Chromium nuclei isolation basic quality control
Kayla Jackson and A. Sina Booeshaghi
2024-05-13
Source:vignettes/vig10_10x_nuclei.Rmd
vig10_10x_nuclei.RmdIntroduction
The data in this vignette is shipped with the cellatlas
repository. The count matrix and metadata are provided in the
cellatlas/examples folder as an AnnData
object. We will begin by loading the object and converting it to a
SingleCellExperiment object.
library(stringr)
library(Matrix)
library(SpatialExperiment)
library(SpatialFeatureExperiment)
library(scater)
library(scuttle)
library(Voyager)
library(ggplot2)
theme_set(theme_bw())
if (!file.exists("10x_nuclei.rds"))
    download.file("https://github.com/pachterlab/voyager/raw/documentation-devel/vignettes/10x_nuclei.rds", destfile = "10x_nuclei.rds")
sce <- readRDS("10x_nuclei.rds")
is_mito <- str_detect(rowData(sce)$gene_name, regex("^mt-", ignore_case=TRUE))
sum(is_mito)
#> [1] 37
sce <- addPerCellQCMetrics(sce, subsets = list(mito = is_mito))
names(colData(sce))
#> [1] "sum"                   "detected"              "subsets_mito_sum"
#> [4] "subsets_mito_detected" "subsets_mito_percent"  "total"
plotColData(sce, "sum") +
    plotColData(sce, "detected") +
    plotColData(sce, "subsets_mito_percent")
#> Warning: Removed 2931 rows containing non-finite outside the scale range
#> (`stat_ydensity()`).
#> Warning: Removed 2931 rows containing missing values or values outside the scale range
#> (`position_quasirandom()`).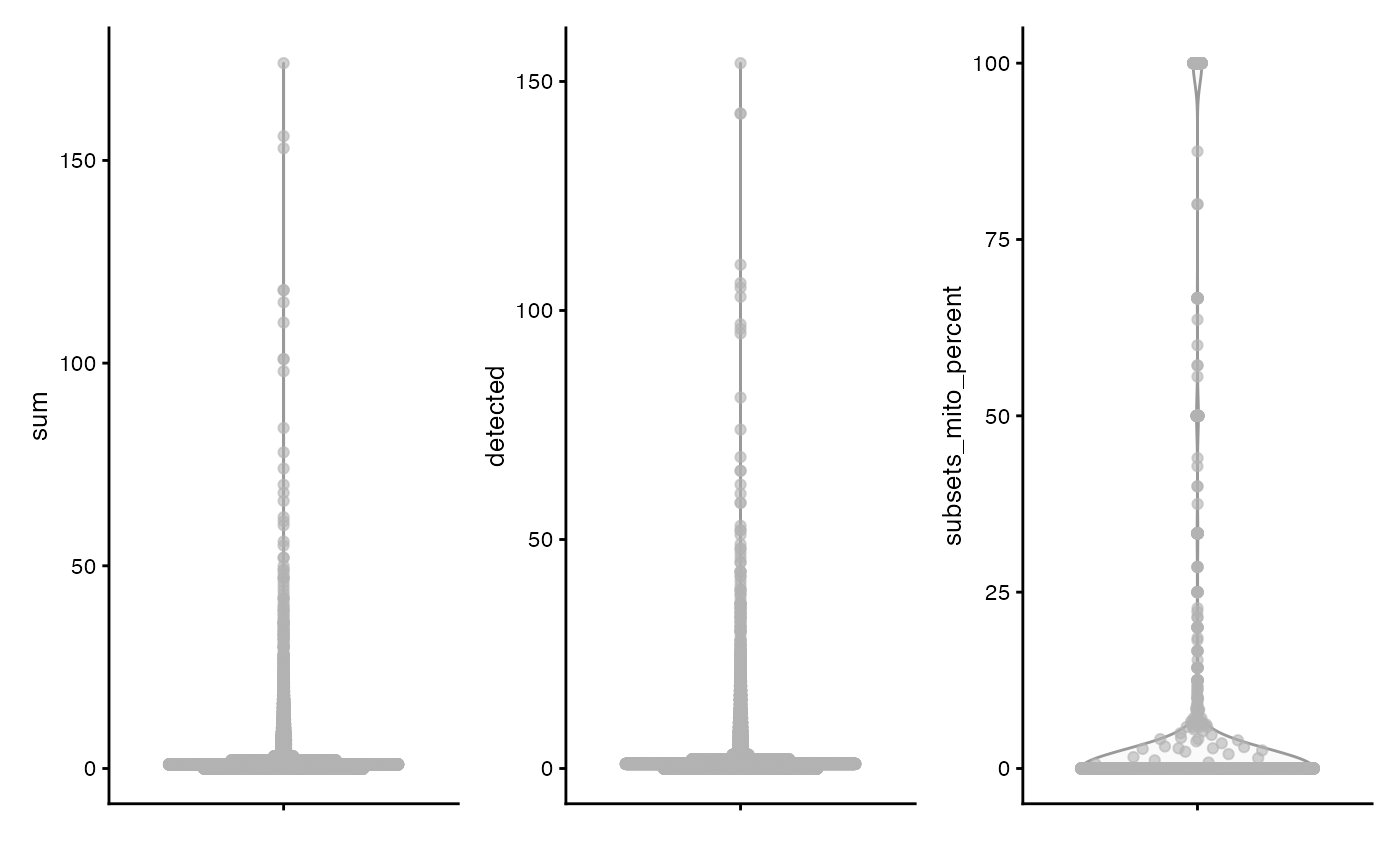
plotColData(sce, x = "sum", y = "detected", bins = 100) +
    scale_fill_distiller(palette = "Blues", direction = 1)
#> Scale for fill is already present.
#> Adding another scale for fill, which will replace the existing scale.
plotColData(sce, x = "sum", y = "subsets_mito_detected", bins = 100) +
    scale_fill_distiller(palette = "Blues", direction = 1)
#> Scale for fill is already present.
#> Adding another scale for fill, which will replace the existing scale.
sce <- sce[, which(sce$subsets_mito_percent < 20)]
sce <- sce[rowSums(counts(sce)) > 0,]

sce
#> class: SingleCellExperiment
#> dim: 5260 9091
#> metadata(0):
#> assays(1): counts
#> rownames(5260): ENSG00000142611.17 ENSG00000142655.13 ...
#>   ENSG00000225685.2 ENSG00000291031.1
#> rowData names(1): gene_name
#> colnames(9091): AAACCCAAGACCATAA AAACCCAAGGTTTGAA ... TTTGTTGTCATCTGTT
#>   TTTGTTGTCCTCCACA
#> colData names(6): sum detected ... subsets_mito_percent total
#> reducedDimNames(0):
#> mainExpName: NULL
#> altExpNames(0):
sessionInfo()
#> R version 4.3.3 (2024-02-29)
#> Platform: x86_64-apple-darwin20 (64-bit)
#> Running under: macOS Ventura 13.6.6
#>
#> Matrix products: default
#> BLAS:   /Library/Frameworks/R.framework/Versions/4.3-x86_64/Resources/lib/libRblas.0.dylib
#> LAPACK: /Library/Frameworks/R.framework/Versions/4.3-x86_64/Resources/lib/libRlapack.dylib;  LAPACK version 3.11.0
#>
#> locale:
#> [1] en_US.UTF-8/en_US.UTF-8/en_US.UTF-8/C/en_US.UTF-8/en_US.UTF-8
#>
#> time zone: UTC
#> tzcode source: internal
#>
#> attached base packages:
#> [1] stats4    stats     graphics  grDevices utils     datasets  methods
#> [8] base
#>
#> other attached packages:
#>  [1] Voyager_1.4.0                  scater_1.30.1
#>  [3] ggplot2_3.5.1                  scuttle_1.12.0
#>  [5] SpatialFeatureExperiment_1.3.0 SpatialExperiment_1.12.0
#>  [7] SingleCellExperiment_1.24.0    SummarizedExperiment_1.32.0
#>  [9] Biobase_2.62.0                 GenomicRanges_1.54.1
#> [11] GenomeInfoDb_1.38.8            IRanges_2.36.0
#> [13] S4Vectors_0.40.2               BiocGenerics_0.48.1
#> [15] MatrixGenerics_1.14.0          matrixStats_1.3.0
#> [17] Matrix_1.6-5                   stringr_1.5.1
#>
#> loaded via a namespace (and not attached):
#>   [1] RColorBrewer_1.1-3        jsonlite_1.8.8
#>   [3] wk_0.9.1                  magrittr_2.0.3
#>   [5] ggbeeswarm_0.7.2          magick_2.8.3
#>   [7] farver_2.1.2              rmarkdown_2.26
#>   [9] fs_1.6.4                  zlibbioc_1.48.2
#>  [11] ragg_1.3.1                vctrs_0.6.5
#>  [13] spdep_1.3-3               memoise_2.0.1
#>  [15] DelayedMatrixStats_1.24.0 RCurl_1.98-1.14
#>  [17] terra_1.7-71              htmltools_0.5.8.1
#>  [19] S4Arrays_1.2.1            BiocNeighbors_1.20.2
#>  [21] Rhdf5lib_1.24.2           s2_1.1.6
#>  [23] SparseArray_1.2.4         rhdf5_2.46.1
#>  [25] sass_0.4.9                spData_2.3.0
#>  [27] KernSmooth_2.23-22        bslib_0.7.0
#>  [29] htmlwidgets_1.6.4         desc_1.4.3
#>  [31] cachem_1.0.8              igraph_2.0.3
#>  [33] lifecycle_1.0.4           pkgconfig_2.0.3
#>  [35] rsvd_1.0.5                R6_2.5.1
#>  [37] fastmap_1.1.1             GenomeInfoDbData_1.2.11
#>  [39] digest_0.6.35             colorspace_2.1-0
#>  [41] ggnewscale_0.4.10         patchwork_1.2.0
#>  [43] RSpectra_0.16-1           irlba_2.3.5.1
#>  [45] textshaping_0.3.7         beachmat_2.18.1
#>  [47] labeling_0.4.3            fansi_1.0.6
#>  [49] abind_1.4-5               compiler_4.3.3
#>  [51] proxy_0.4-27              withr_3.0.0
#>  [53] BiocParallel_1.36.0       viridis_0.6.5
#>  [55] DBI_1.2.2                 highr_0.10
#>  [57] HDF5Array_1.30.1          DelayedArray_0.28.0
#>  [59] rjson_0.2.21              classInt_0.4-10
#>  [61] bluster_1.12.0            tools_4.3.3
#>  [63] units_0.8-5               vipor_0.4.7
#>  [65] beeswarm_0.4.0            glue_1.7.0
#>  [67] rhdf5filters_1.14.1       grid_4.3.3
#>  [69] sf_1.0-16                 cluster_2.1.6
#>  [71] generics_0.1.3            gtable_0.3.5
#>  [73] class_7.3-22              BiocSingular_1.18.0
#>  [75] ScaledMatrix_1.10.0       sp_2.1-4
#>  [77] utf8_1.2.4                XVector_0.42.0
#>  [79] ggrepel_0.9.5             pillar_1.9.0
#>  [81] limma_3.58.1              dplyr_1.1.4
#>  [83] lattice_0.22-6            deldir_2.0-4
#>  [85] tidyselect_1.2.1          locfit_1.5-9.9
#>  [87] knitr_1.45                gridExtra_2.3
#>  [89] edgeR_4.0.16              xfun_0.43
#>  [91] statmod_1.5.0             stringi_1.8.4
#>  [93] yaml_2.3.8                boot_1.3-30
#>  [95] evaluate_0.23             codetools_0.2-20
#>  [97] tibble_3.2.1              cli_3.6.2
#>  [99] systemfonts_1.0.6         munsell_0.5.1
#> [101] jquerylib_0.1.4           Rcpp_1.0.12
#> [103] parallel_4.3.3            pkgdown_2.0.9
#> [105] sparseMatrixStats_1.14.0  bitops_1.0-7
#> [107] viridisLite_0.4.2         scales_1.3.0
#> [109] e1071_1.7-14              purrr_1.0.2
#> [111] crayon_1.5.2              scico_1.5.0
#> [113] rlang_1.1.3               cowplot_1.1.3