Plot histograms for colData and rowData columns
Source:R/plot-non-spatial.R
plotColDataHistogram.RdPlot histograms for colData and rowData columns
Usage
plotColDataHistogram(
  sce,
  feature,
  fill_by = NULL,
  facet_by = NULL,
  subset = NULL,
  bins = 100,
  binwidth = NULL,
  scales = "free",
  ncol = 1,
  position = "stack",
  ...
)

plotRowDataHistogram(
  sce,
  feature,
  fill_by = NULL,
  facet_by = NULL,
  subset = NULL,
  bins = 100,
  binwidth = NULL,
  scales = "free",
  ncol = 1,
  position = "stack",
  ...
)
Arguments
- sce
A
SingleCellExperimentobject.- feature
Names of columns in
colDataorrowDatato plot. When multiple features are specified, they will be plotted in separate facets.- fill_by
Name of a categorical column in
colDataorrowDatato fill the histogram.- facet_by
Column in
colDataorrowDatato facet with. When multiple features are plotted, the features will be in different facets. In this case, settingfacet_bywill callfacet_gridso the features are in rows and categories infacet_bywill be in columns.- subset
Name of a logical column to only plot a subset of the data.
- bins
Numeric vector giving number of bins in both vertical and horizontal directions. Set to 100 by default.
- binwidth
The width of the bins. Can be specified as a numeric value or as a function that calculates width from unscaled x. Here, "unscaled x" refers to the original x values in the data, before application of any scale transformation. When specifying a function along with a grouping structure, the function will be called once per group. The default is to use the number of bins in
bins, covering the range of the data. You should always override this value, exploring multiple widths to find the best to illustrate the stories in your data.The bin width of a date variable is the number of days in each time; the bin width of a time variable is the number of seconds.
- scales
Should scales be fixed (
"fixed", the default), free ("free"), or free in one dimension ("free_x","free_y")?- ncol
Number of columns in the facetting.
- position
Position adjustment, either as a string naming the adjustment (e.g.
"jitter"to useposition_jitter), or the result of a call to a position adjustment function. Use the latter if you need to change the settings of the adjustment.- ...
Other arguments passed on to
layer(). These are often aesthetics, used to set an aesthetic to a fixed value, likecolour = "red"orsize = 3. They may also be parameters to the paired geom/stat.
Examples
library(SFEData)
sfe <- McKellarMuscleData()
#> see ?SFEData and browseVignettes('SFEData') for documentation
#> loading from cache
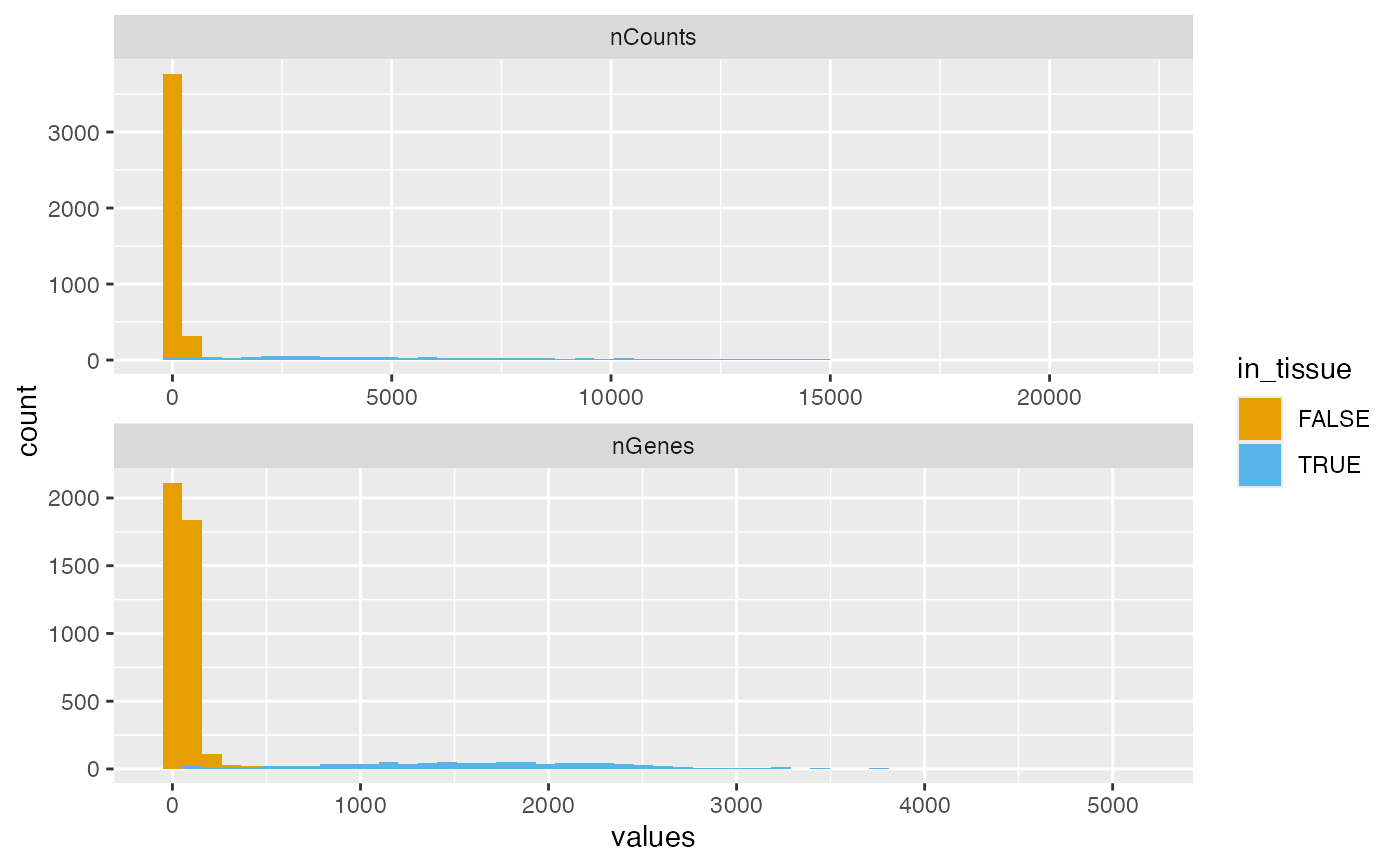
plotColDataHistogram(sfe, c("nCounts", "nGenes"), fill_by = "in_tissue",
bins = 50, position = "stack")
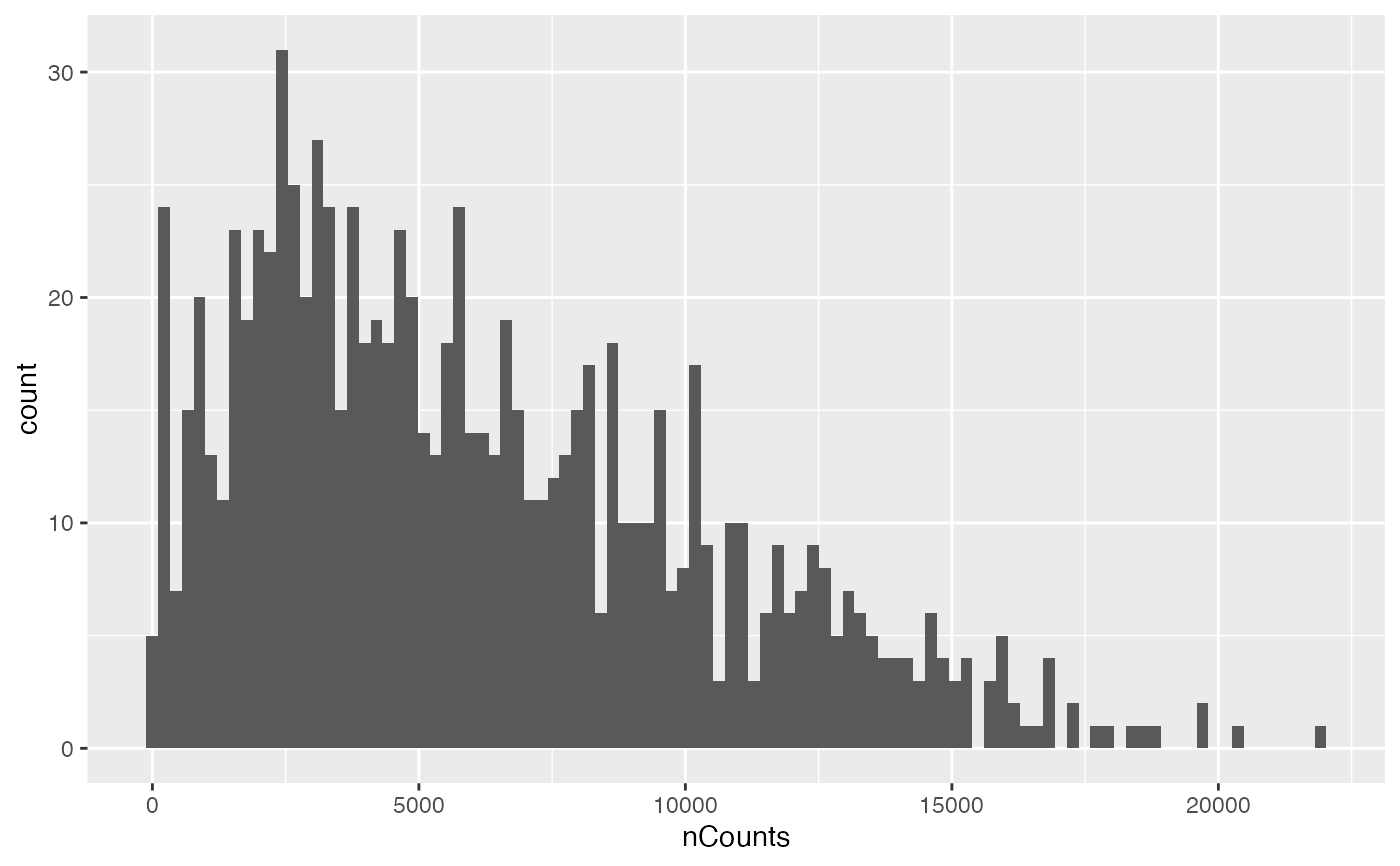
 plotColDataHistogram(sfe, "nCounts", subset = "in_tissue")
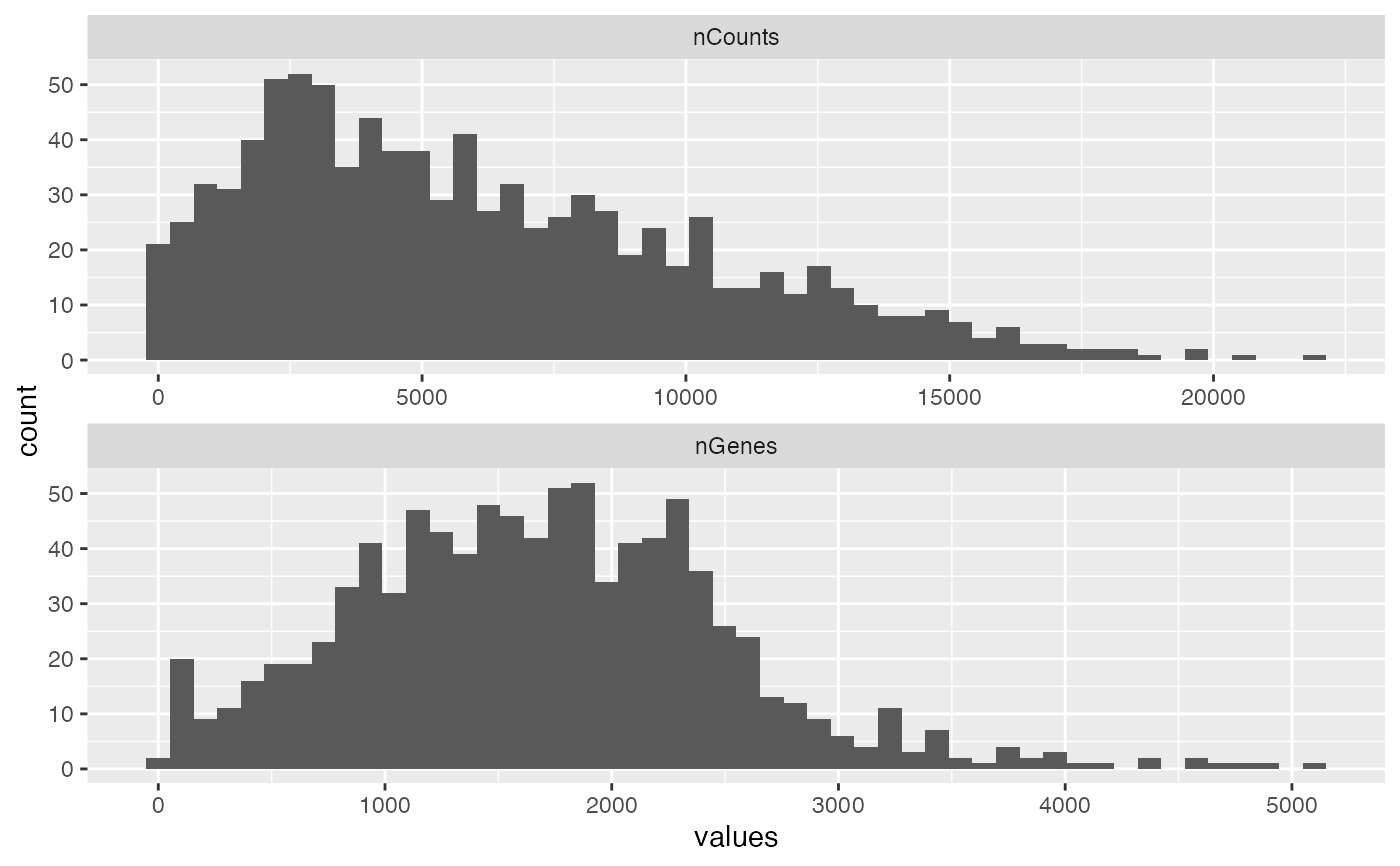
 sfe2 <- sfe[, sfe$in_tissue]
plotColDataHistogram(sfe2, c("nCounts", "nGenes"), bins = 50)
sfe2 <- sfe[, sfe$in_tissue]
plotColDataHistogram(sfe2, c("nCounts", "nGenes"), bins = 50)