Seurat_to_SFE
NOTE: supports Visium, Vizgen and Xenium
Alik Huseynov
2026-04-24
Source:vignettes/seurat_sfe_coerce.Rmd
seurat_sfe_coerce.RmdSetup
# set R options, paths, object params, names, functions, etc..
message("Setting options, paths and object params..")
## Setting options, paths and object params..
Sys.setenv(LANG = "en")

# To get metadata df from SFE or Seurat object
getMeta <-
  function(object = NULL) {
    if (class(object) == "Seurat") {
      #is(object, "Seurat")
      # return Seurat metadata
      return(methods::slot(object, name = "meta.data"))
      } else {
        return(colData(object) |>
                 methods::slot(name = "listData") |>
                 as.data.frame.list())
      }
    }

# set root dir
dir_extdata <- system.file("extdata", package = "SpatialFeatureExperiment")

# set BPPARAM
BPPARAM <- BiocParallel::MulticoreParam(3,
                                        tasks = 2L,
                                        force.GC = FALSE,
                                        progressbar = TRUE)
Load R packages
suppressPackageStartupMessages({
    library(ggplot2)
    #library(SingleCellExperiment)
    library(scater)
    library(scuttle)
    library(Seurat)
    #library(SeuratData)
    #library(dplyr)
    library(magrittr)
    #library(scales)
    #library(spatstat)
    library(patchwork)
    #library(Matrix)
    #library(SpatialExperiment)
    library(Voyager)
    library(SpatialFeatureExperiment)
    library(SFEData)
    #library(terra)
    #library(BiocParallel)
    #library(sf)
    })
## There appears to be a problem with the PROJ installationLoad Seurat v5 objects - 1 sample
Note, these object were generated a priori, object names with (eg
*_vis for Visium) correspond to specific spatial tech
obj_vz <- SeuratTestData("Vizgen")## see ?SFEData and browseVignettes('SFEData') for documentation## downloading 1 resources## retrieving 1 resource## loading from cache
obj_vz## An object of class Seurat
## 49 features across 1058 samples within 1 assay
## Active assay: Vizgen (49 features, 0 variable features)
## 2 layers present: counts, data
## 1 spatial field of view present: vz.toy.1
obj_xen <- SeuratTestData("Xenium")## see ?SFEData and browseVignettes('SFEData') for documentation## downloading 1 resources## retrieving 1 resource## loading from cache
obj_xen## An object of class Seurat
## 541 features across 16324 samples within 4 assays
## Active assay: Xenium (27 features, 0 variable features)
## 2 layers present: counts, data
## 3 other assays present: BlankCodeword, ControlCodeword, ControlProbe
## 1 spatial field of view present: xen.toy.1## An object of class Seurat
## 5 features across 12 samples within 1 assay
## Active assay: RNA (5 features, 0 variable features)
## 1 layer present: counts
## 1 image present: sample01
obj_vishd <- SeuratTestData("VisiumHD8") # Visium HD## see ?SFEData and browseVignettes('SFEData') for documentation## downloading 1 resources## retrieving 1 resource## loading from cache
obj_vishd## An object of class Seurat
## 50 features across 393543 samples within 1 assay
## Active assay: Spatial.008um (50 features, 0 variable features)
## 2 layers present: counts, data
## 1 spatial field of view present: slice1.008umConvert Seurat -> SFE - Visium (toy data)
showMethods("toSpatialFeatureExperiment")## Function: toSpatialFeatureExperiment (package SpatialFeatureExperiment)
## x="Seurat"
## x="SingleCellExperiment"
## x="SpatialExperiment"
# real Visium data
sfe_conv_vis <-
  toSpatialFeatureExperiment(x = obj_vis,
                             image_scalefactors = "lowres",
                             unit = "micron",
                             BPPARAM = BPPARAM)
## >>> Seurat Assays found: RNA
## >>> RNA -> will be used as 'Main Experiment'## >>> Seurat spatial object found: VisiumV1
## >>> 'full_res_image_pixel' units will be used ->
## ie 'imagerow' & 'imagecol' without scaling factors
## >>> set `unit = 'micron'` to convert spot coordinates to micron space## >>> Generating `sf` geometries## Warning: Layer 'data' is empty## Warning: Layer 'scale.data' is empty##
## >>> Creating `SFE` object -> sample01## >>> Converting pixels to microns
sfe_conv_vis## class: SpatialFeatureExperiment
## dim: 5 12
## metadata(0):
## assays(1): counts
## rownames(5): ACPP KLK3 MSMB TGM4 TAGLN
## rowData names(0):
## colnames(12): GTGGCGTGCACCAGAG-1 GGTCCCATAACATAGA-1 ...
## CTTCCTGCATATTTAC-1 CAATATGTAGATTTAC-1
## colData names(7): orig.ident nCount_RNA ... in_tissue sample_id
## reducedDimNames(0):
## mainExpName: RNA
## altExpNames(0):
## spatialCoords names(2) : X Y
## imgData names(0):
##
## unit: micron
## Geometries:
## colGeometries: spotPoly (POLYGON)
##
## Graphs:
## sample01:
getMeta(sfe_conv_vis) %>% str## 'data.frame': 12 obs. of 7 variables:
## $ orig.ident : Factor w/ 1 level "SeuratProject": 1 1 1 1 1 1 1 1 1 1 ...
## $ nCount_RNA : num 165 118 122 709 375 521 167 148 73 137 ...
## $ nFeature_RNA: int 5 5 5 5 5 5 5 5 5 5 ...
## $ array_row : int 1 1 1 3 2 3 3 5 4 5 ...
## $ array_col : int 101 103 105 101 102 103 105 101 102 103 ...
## $ in_tissue : logi TRUE TRUE TRUE TRUE TRUE TRUE ...
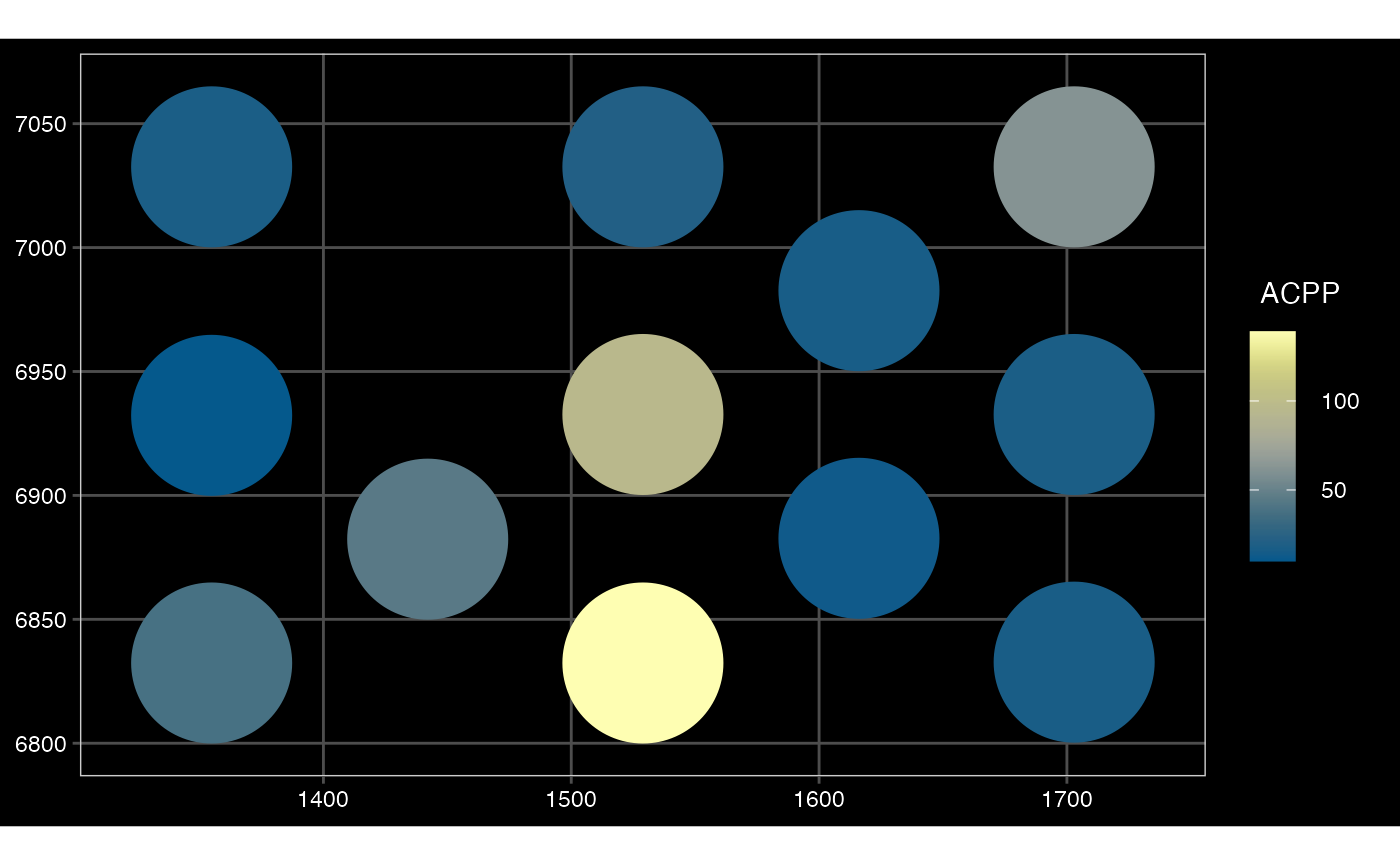
## $ sample_id : chr "sample01" "sample01" "sample01" "sample01" ...Plot converted SFE Visium (toy data)
plotSpatialFeature(sfe_conv_vis, exprs_values = "counts",
                   features = rownames(sfe_conv_vis)[1],
                   size = 1, colGeometryName = "spotPoly",
                   dark = TRUE,
                   show_axes = TRUE,
                   #sample_id = "",
                   scattermore = FALSE # will plot only centroids!
                  )
Load Visium Seurat object (real data)
Visium data is taken from SeuratData (ie
stxBrain.SeuratData), subsetted to keep first 50 genes, and
added to ./inst/extdata/. Note, the spot diameter was added
manually as 80, since older Seurat version had a bug when
adding spatial infos to scale.factors, $spot
was too small and same as $hires
Note that as of April 2026, Seurat::SpatialFeaturePlot
has an error regarding UpdateSeuratObject.
This problem is resolved in version 5.4.0.9002, which does
not seem to on CRAN yet as of writing. Use
pak::pak("satijalab/seurat") to install this version.
obj_vis2 <- SeuratTestData("Visium") |> UpdateSeuratObject()## see ?SFEData and browseVignettes('SFEData') for documentation## downloading 1 resources## retrieving 1 resource## loading from cache## Warning: Not validating Assay objects
## Not validating Assay objects## Warning: Not validating Seurat objects## Validating object structure## Updating object slots## Ensuring keys are in the proper structure
## Ensuring keys are in the proper structure## Ensuring feature names don't have underscores or pipes## Updating slots in Spatial## Updating slots in anterior1## Validating object structure for Assay 'Spatial'## Validating object structure for VisiumV1 'anterior1'## Object representation is consistent with the most current Seurat version
obj_vis2## An object of class Seurat
## 50 features across 2696 samples within 1 assay
## Active assay: Spatial (50 features, 0 variable features)
## 2 layers present: counts, data
## 1 image present: anterior1
# plot it
SpatialFeaturePlot(obj_vis2, features = rownames(obj_vis2)[1])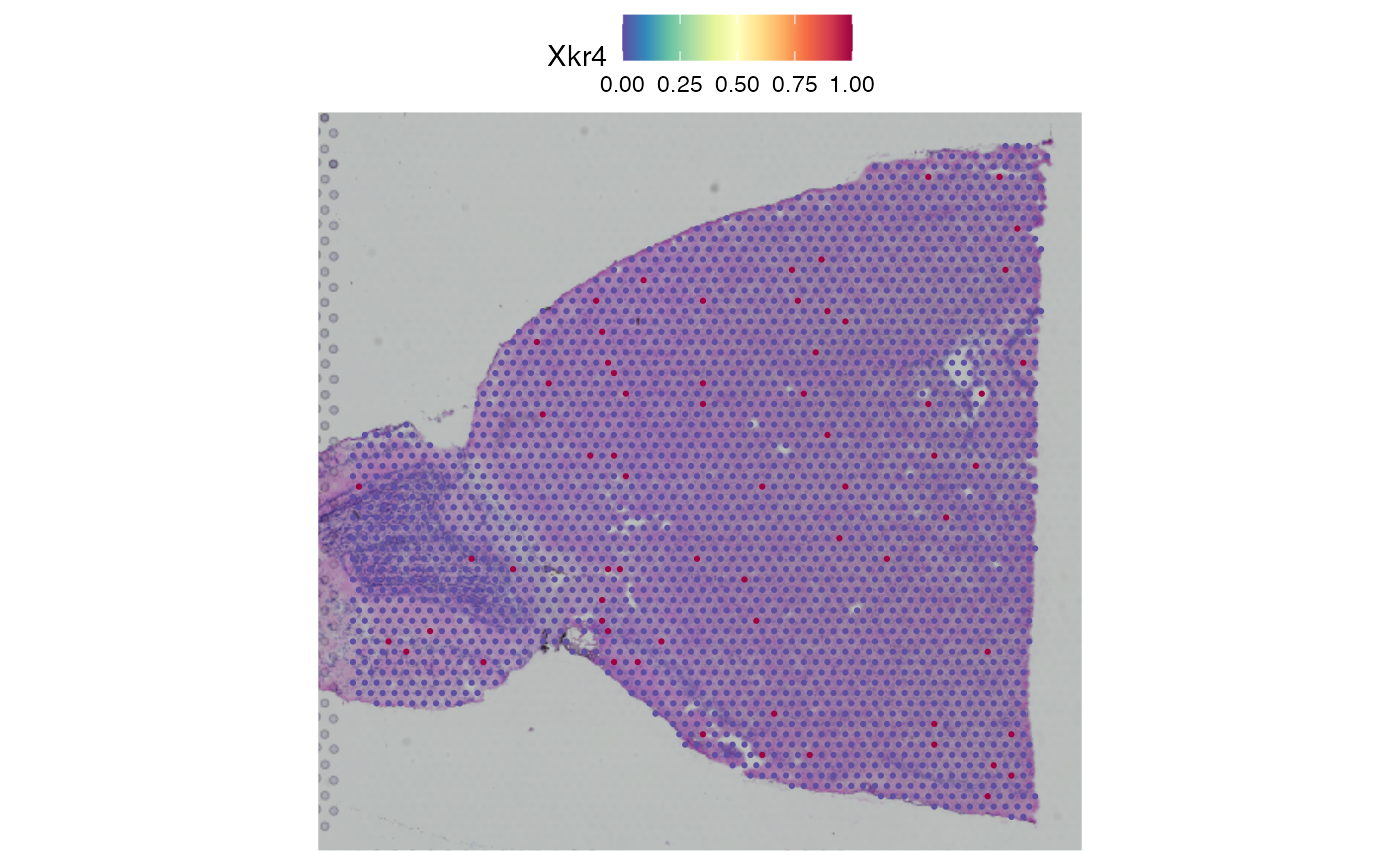 ## Convert Seurat -> SFE - Visium (real data)
# real Visium data
sfe_conv_vis2 <-
  toSpatialFeatureExperiment(x = obj_vis2,
                             image_scalefactors = "lowres",
                             unit = "micron",
                             BPPARAM = BPPARAM)
## >>> Seurat Assays found: Spatial
## >>> Spatial -> will be used as 'Main Experiment'## >>> Seurat spatial object found: VisiumV1
## >>> 'full_res_image_pixel' units will be used ->
## ie 'imagerow' & 'imagecol' without scaling factors
## >>> set `unit = 'micron'` to convert spot coordinates to micron space## >>> Generating `sf` geometries## Warning: Layer 'scale.data' is empty##
## >>> Creating `SFE` object -> anterior1## >>> Converting pixels to microns
sfe_conv_vis2## class: SpatialFeatureExperiment
## dim: 50 2696
## metadata(0):
## assays(2): counts logcounts
## rownames(50): Xkr4 Gm1992 ... Ncoa2 Gm29570
## rowData names(0):
## colnames(2696): AAACAAGTATCTCCCA-1 AAACACCAATAACTGC-1 ...
## TTGTTTCACATCCAGG-1 TTGTTTCCATACAACT-1
## colData names(9): orig.ident nCount_Spatial ... in_tissue sample_id
## reducedDimNames(0):
## mainExpName: Spatial
## altExpNames(0):
## spatialCoords names(2) : X Y
## imgData names(0):
##
## unit: micron
## Geometries:
## colGeometries: spotPoly (POLYGON)
##
## Graphs:
## anterior1:
getMeta(sfe_conv_vis2) %>% str## 'data.frame': 2696 obs. of 9 variables:
## $ orig.ident : Factor w/ 1 level "anterior1": 1 1 1 1 1 1 1 1 1 1 ...
## $ nCount_Spatial : num 17 35 34 44 35 11 48 49 13 64 ...
## $ nFeature_Spatial: int 9 16 11 14 17 9 16 19 9 15 ...
## $ slice : num 1 1 1 1 1 1 1 1 1 1 ...
## $ region : chr "anterior" "anterior" "anterior" "anterior" ...
## $ array_row : int 50 59 14 43 47 62 61 42 52 65 ...
## $ array_col : int 102 19 94 9 13 0 97 28 42 83 ...
## $ in_tissue : logi TRUE TRUE TRUE TRUE TRUE TRUE ...
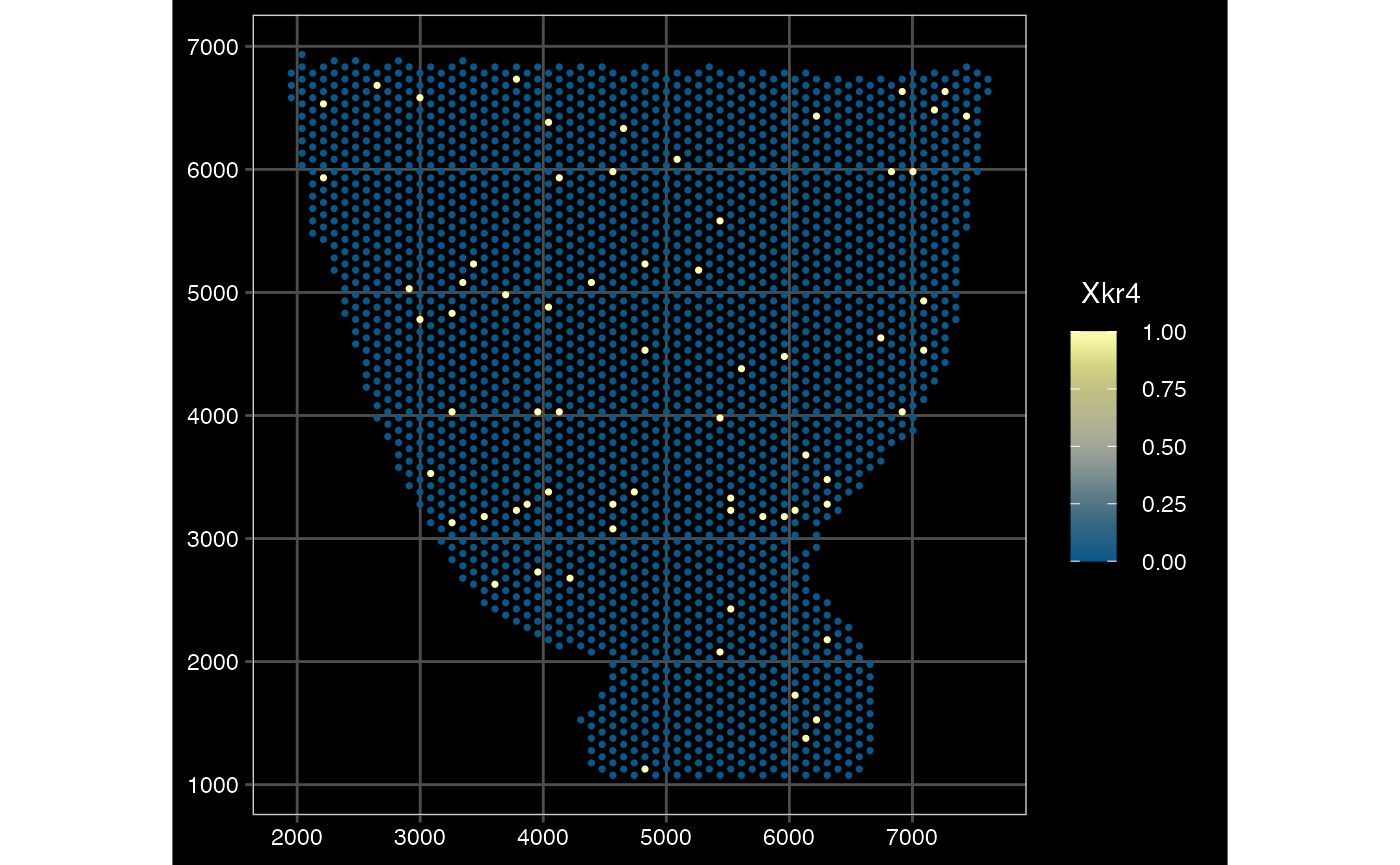
## $ sample_id : chr "anterior1" "anterior1" "anterior1" "anterior1" ...Plot converted Seurat to SFE - Visium
plotSpatialFeature(sfe_conv_vis2, exprs_values = "counts",
                   features = rownames(sfe_conv_vis2)[1],
                   #size = 1, colGeometryName = "spotPoly",
                   dark = TRUE,
                   show_axes = TRUE,
                   #sample_id = "",
                   scattermore = FALSE # will plot only centroids!
                  )
Convert Seurat -> SFE - Visium HD
sfe_vishd <-
  toSpatialFeatureExperiment(x = obj_vishd,
                             image_scalefactors = "lowres",
                             unit = "micron", #"full_res_image_pixel",
                             BPPARAM = BPPARAM)
## >>> Seurat Assays found: Spatial.008um
## >>> Spatial.008um -> will be used as 'Main Experiment'## >>> Generating `sf` geometries## >>> Seurat spatial object found: VisiumV2 -> VisiumHD## >>> Making POLYGON geometry for bin size: 8 μm with total of 393543 cells, this can take some time!## Warning: Layer 'scale.data' is empty##
## >>> Creating `SFE` object -> slice1.008um## >>> Converting pixels to microns
sfe_vishd## class: SpatialFeatureExperiment
## dim: 50 393543
## metadata(0):
## assays(2): counts logcounts
## rownames(50): Xkr4 Rp1 ... Gdap1 Pi15
## rowData names(0):
## colnames(393543): s_008um_00301_00321-1 s_008um_00602_00290-1 ...
## s_008um_00373_00222-1 s_008um_00595_00611-1
## colData names(4): orig.ident nCount_Spatial.008um
## nFeature_Spatial.008um sample_id
## reducedDimNames(0):
## mainExpName: Spatial.008um
## altExpNames(0):
## spatialCoords names(2) : X Y
## imgData names(0):
##
## unit: micron
## Geometries:
## colGeometries: spotPoly (POLYGON)
##
## Graphs:
## slice1_008um:
getMeta(sfe_vishd) %>% str## 'data.frame': 393543 obs. of 4 variables:
## $ orig.ident : chr "s" "s" "s" "s" ...
## $ nCount_Spatial.008um : num 0 1 3 3 0 0 1 1 0 2 ...
## $ nFeature_Spatial.008um: int 0 1 3 3 0 0 1 1 0 2 ...
## $ sample_id : chr "slice1_008um" "slice1_008um" "slice1_008um" "slice1_008um" ...Plot converted Seurat to SFE - Visium HD
plotSpatialFeature(sfe_vishd, exprs_values = "counts",
                   features = rownames(sfe_vishd)[1],
                   size = 1, colGeometryName = "spotPoly",
                   dark = TRUE,
                   show_axes = TRUE,
                   #sample_id = "",
                   scattermore = TRUE
                  )
## scattermore and binning only apply to points. Using centroids.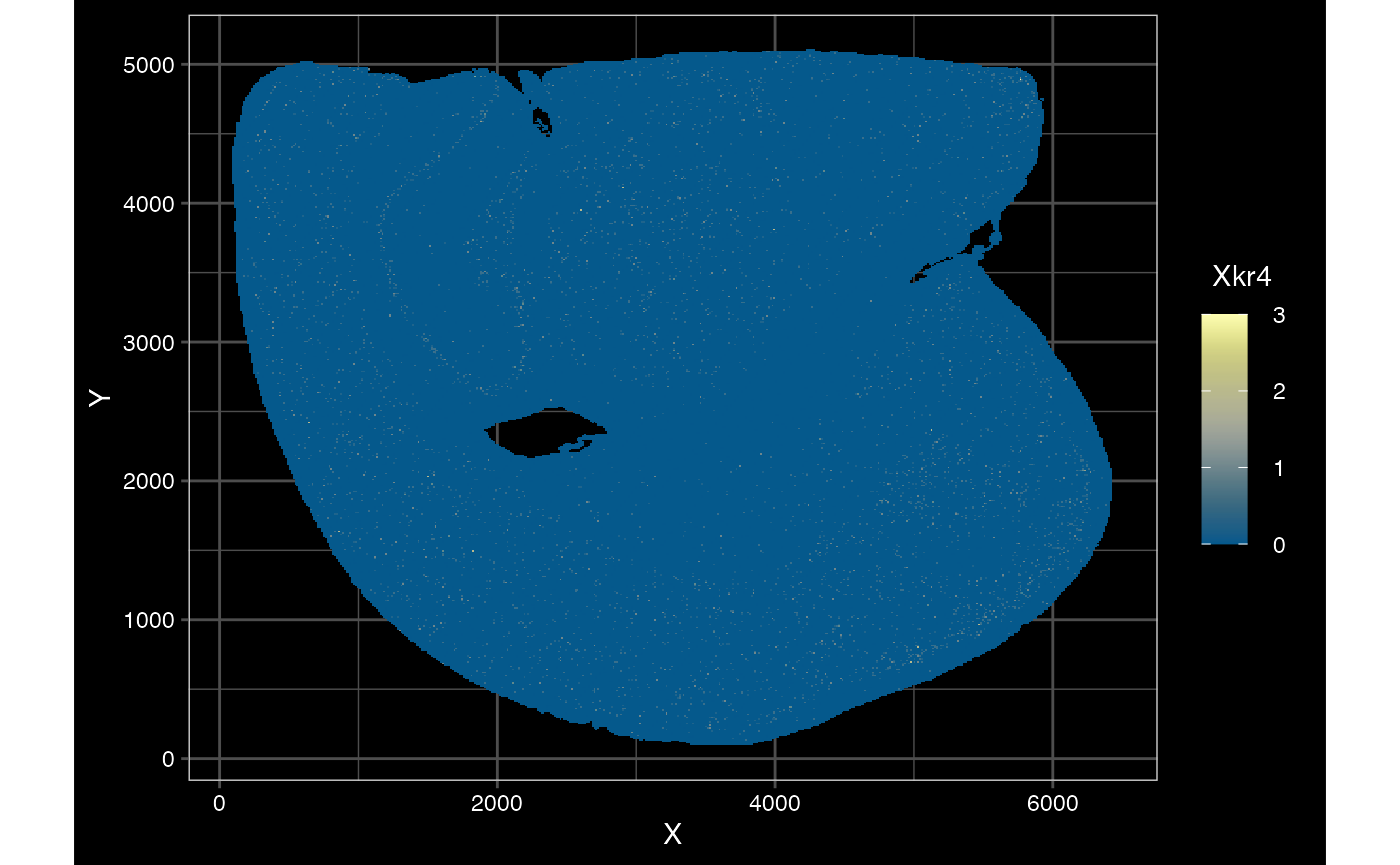
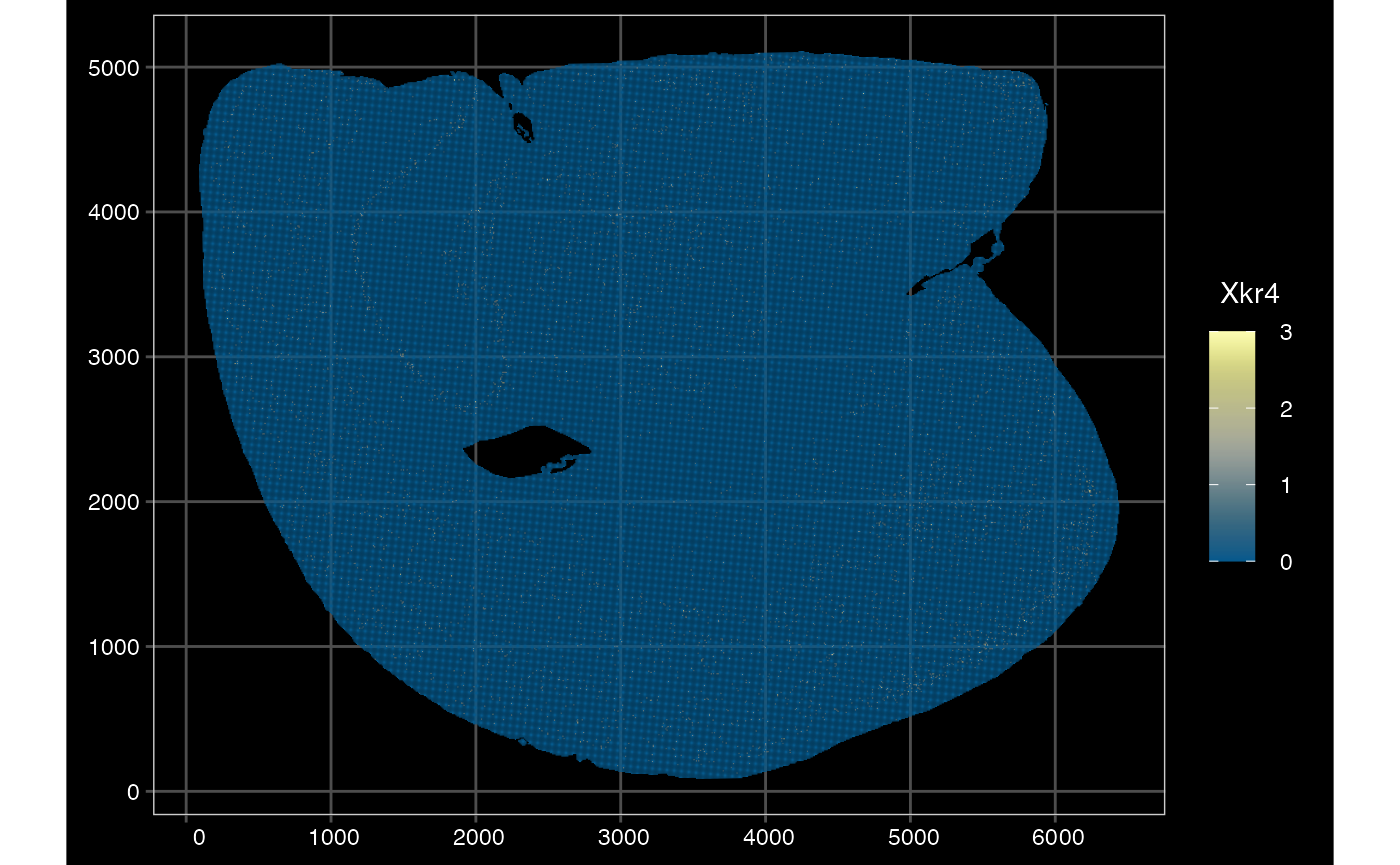
plotSpatialFeature(sfe_vishd, exprs_values = "counts",
                   features = rownames(sfe_vishd)[1],
                   size = 0, colGeometryName = "spotPoly",
                   dark = TRUE,
                   show_axes = TRUE,
                   #sample_id = "",
                   scattermore = FALSE
                  )
Convert Seurat -> SFE - Xenium
# slim down Xenium obj to keep only 1 Assay
if (!exists("obj_xen_slim"))
  obj_xen_slim <- DietSeurat(obj_xen, assays = "Xenium")
obj_xen_slim <- UpdateSeuratObject(obj_xen_slim)
## Validating object structure## Updating object slots## Ensuring keys are in the proper structure
## Ensuring keys are in the proper structure## Ensuring feature names don't have underscores or pipes## Updating slots in Xenium## Updating slots in xen.toy.1## Validating object structure for Assay 'Xenium'## Validating object structure for FOV 'xen.toy.1'## Object representation is consistent with the most current Seurat version
#real data subset
sfe_conv_xen <-
  toSpatialFeatureExperiment(x = obj_xen_slim,
                             add_molecules = FALSE,
                             flip = "geometry",
                             #unit = "micron",
                             BPPARAM = BPPARAM
                             )
## >>> Seurat Assays found: Xenium
## >>> Xenium -> will be used as 'Main Experiment'## >>> Seurat spatial FOVs found:
## centroids
## segmentation
## molecules## >>> Generating `sf` geometries## Warning: Layer 'scale.data' is empty##
## >>> Creating `SFE` object -> xen.toy.1
sfe_conv_xen## class: SpatialFeatureExperiment
## dim: 27 16324
## metadata(0):
## assays(2): counts logcounts
## rownames(27): AKT1 ALDH1A2 ... SNHG32 SPIB
## rowData names(0):
## colnames(16324): aaacmono-1 aaaekabk-1 ... ojeogmfc-1 ojfcjbep-1
## colData names(10): orig.ident nCount_Xenium ... nFeature_ControlProbe
## sample_id
## reducedDimNames(0):
## mainExpName: Xenium
## altExpNames(0):
## spatialCoords names(2) : X Y
## imgData names(0):
##
## unit: micron
## Geometries:
## colGeometries: centroids (POINT), cellSeg (POLYGON)
##
## Graphs:
## xen_toy_1:
getMeta(sfe_conv_xen) %>% str## 'data.frame': 16324 obs. of 10 variables:
## $ orig.ident : chr "xen.toy.1" "xen.toy.1" "xen.toy.1" "xen.toy.1" ...
## $ nCount_Xenium : num 94 12 174 60 158 44 88 80 15 84 ...
## $ nFeature_Xenium : int 20 6 20 15 17 14 19 16 9 15 ...
## $ nCount_BlankCodeword : num 0 0 0 0 0 0 1 0 0 0 ...
## $ nFeature_BlankCodeword : int 0 0 0 0 0 0 1 0 0 0 ...
## $ nCount_ControlCodeword : num 0 0 0 0 0 0 0 0 0 0 ...
## $ nFeature_ControlCodeword: int 0 0 0 0 0 0 0 0 0 0 ...
## $ nCount_ControlProbe : num 0 0 0 0 0 0 0 0 0 0 ...
## $ nFeature_ControlProbe : int 0 0 0 0 0 0 0 0 0 0 ...
## $ sample_id : chr "xen_toy_1" "xen_toy_1" "xen_toy_1" "xen_toy_1" ...
getMeta(obj_xen) %>% str## 'data.frame': 16324 obs. of 9 variables:
## $ orig.ident : chr "xen.toy.1" "xen.toy.1" "xen.toy.1" "xen.toy.1" ...
## $ nCount_Xenium : num 94 12 174 60 158 44 88 80 15 84 ...
## $ nFeature_Xenium : int 20 6 20 15 17 14 19 16 9 15 ...
## $ nCount_BlankCodeword : num 0 0 0 0 0 0 1 0 0 0 ...
## $ nFeature_BlankCodeword : int 0 0 0 0 0 0 1 0 0 0 ...
## $ nCount_ControlCodeword : num 0 0 0 0 0 0 0 0 0 0 ...
## $ nFeature_ControlCodeword: int 0 0 0 0 0 0 0 0 0 0 ...
## $ nCount_ControlProbe : num 0 0 0 0 0 0 0 0 0 0 ...
## $ nFeature_ControlProbe : int 0 0 0 0 0 0 0 0 0 0 ...
Plot converted Seurat to SFE - Xenium
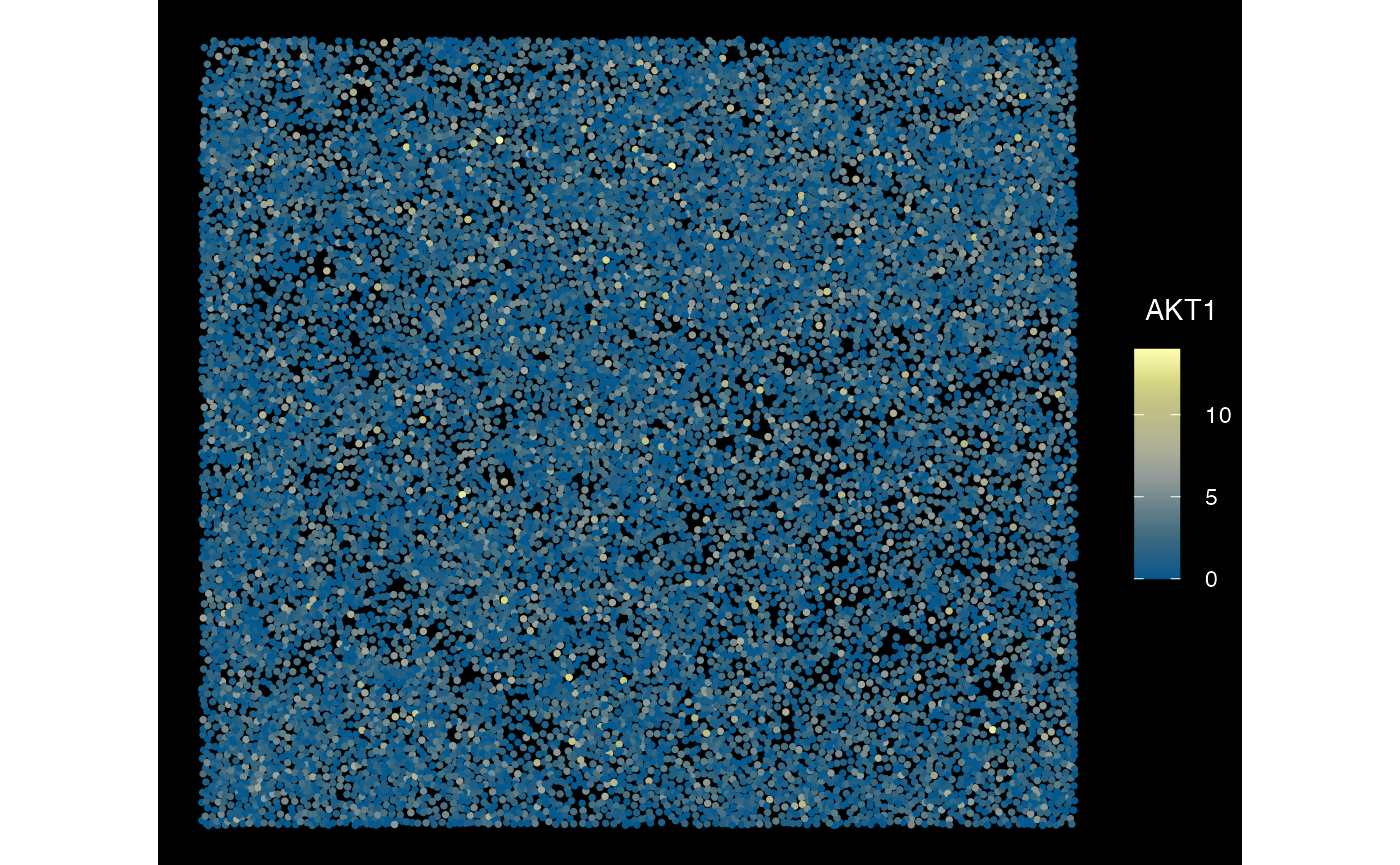
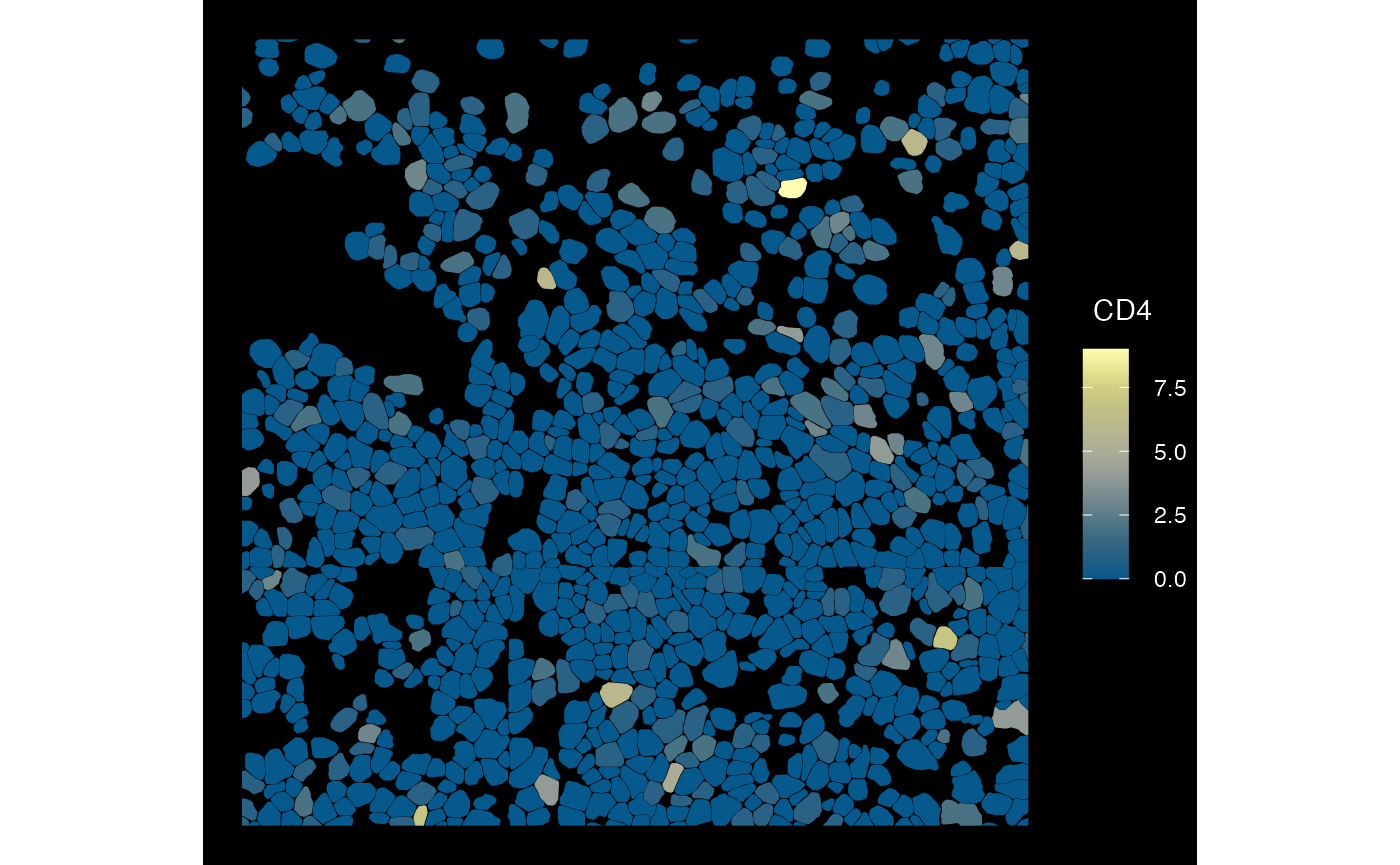
plotSpatialFeature(sfe_conv_xen, exprs_values = "counts",
                   features = rownames(sfe_conv_xen)[1],
                   size = 1, colGeometryName = "centroids",
                   dark = TRUE,
                   #sample_id = "",
                   scattermore = FALSE # will plot only centroids!
                  )
plotSpatialFeature(sfe_conv_xen, exprs_values = "counts",
                   features = rownames(sfe_conv_xen)[1],
                   size = 1, colGeometryName = "cellSeg",
                   dark = TRUE,
                   #sample_id = "",
                   scattermore = FALSE # will plot only centroids!
                  )
Convert Seurat -> SFE - Vizgen
sfe_conv_vz <-
  toSpatialFeatureExperiment(x = obj_vz,
                             add_molecules = FALSE,
                             flip = "geometry",
                             #unit = "micron",
                             BPPARAM = BPPARAM)
## >>> Seurat Assays found: Vizgen
## >>> Vizgen -> will be used as 'Main Experiment'## >>> Seurat spatial FOVs found:
## centroids
## segmentation
## molecules## >>> Generating `sf` geometries## Warning: Layer 'scale.data' is empty##
## >>> Creating `SFE` object -> vz.toy.1
sfe_conv_vz## class: SpatialFeatureExperiment
## dim: 49 1046
## metadata(0):
## assays(2): counts logcounts
## rownames(49): CD4 TLL1 ... SRC HLA-DRB1
## rowData names(0):
## colnames(1046): 112824700230101253 112824700230101254 ...
## 112824700330100920 112824700330100974
## colData names(7): orig.ident nCount_Vizgen ... fov sample_id
## reducedDimNames(0):
## mainExpName: Vizgen
## altExpNames(0):
## spatialCoords names(2) : X Y
## imgData names(0):
##
## unit: micron
## Geometries:
## colGeometries: centroids (POINT), cellSeg (POLYGON)
##
## Graphs:
## vz_toy_1:
getMeta(sfe_conv_vz) %>% str## 'data.frame': 1046 obs. of 7 variables:
## $ orig.ident : chr "vz.toy.1" "vz.toy.1" "vz.toy.1" "vz.toy.1" ...
## $ nCount_Vizgen : num 60 127 107 55 165 14 38 74 33 42 ...
## $ nFeature_Vizgen: int 19 25 26 19 24 8 16 14 13 14 ...
## $ z : int 3 3 3 3 3 3 3 3 3 3 ...
## $ volume : num 839 803 527 461 584 ...
## $ fov : logi NA NA NA NA NA NA ...
## $ sample_id : chr "vz_toy_1" "vz_toy_1" "vz_toy_1" "vz_toy_1" ...
getMeta(obj_vz) %>% str## 'data.frame': 1058 obs. of 6 variables:
## $ orig.ident : chr "vz.toy.1" "vz.toy.1" "vz.toy.1" "vz.toy.1" ...
## $ nCount_Vizgen : num 69 57 60 127 107 55 165 14 38 74 ...
## $ nFeature_Vizgen: int 20 19 19 25 26 19 24 8 16 14 ...
## $ z : int 3 3 3 3 3 3 3 3 3 3 ...
## $ volume : num 654 487 839 803 527 ...
## $ fov : logi NA NA NA NA NA NA ...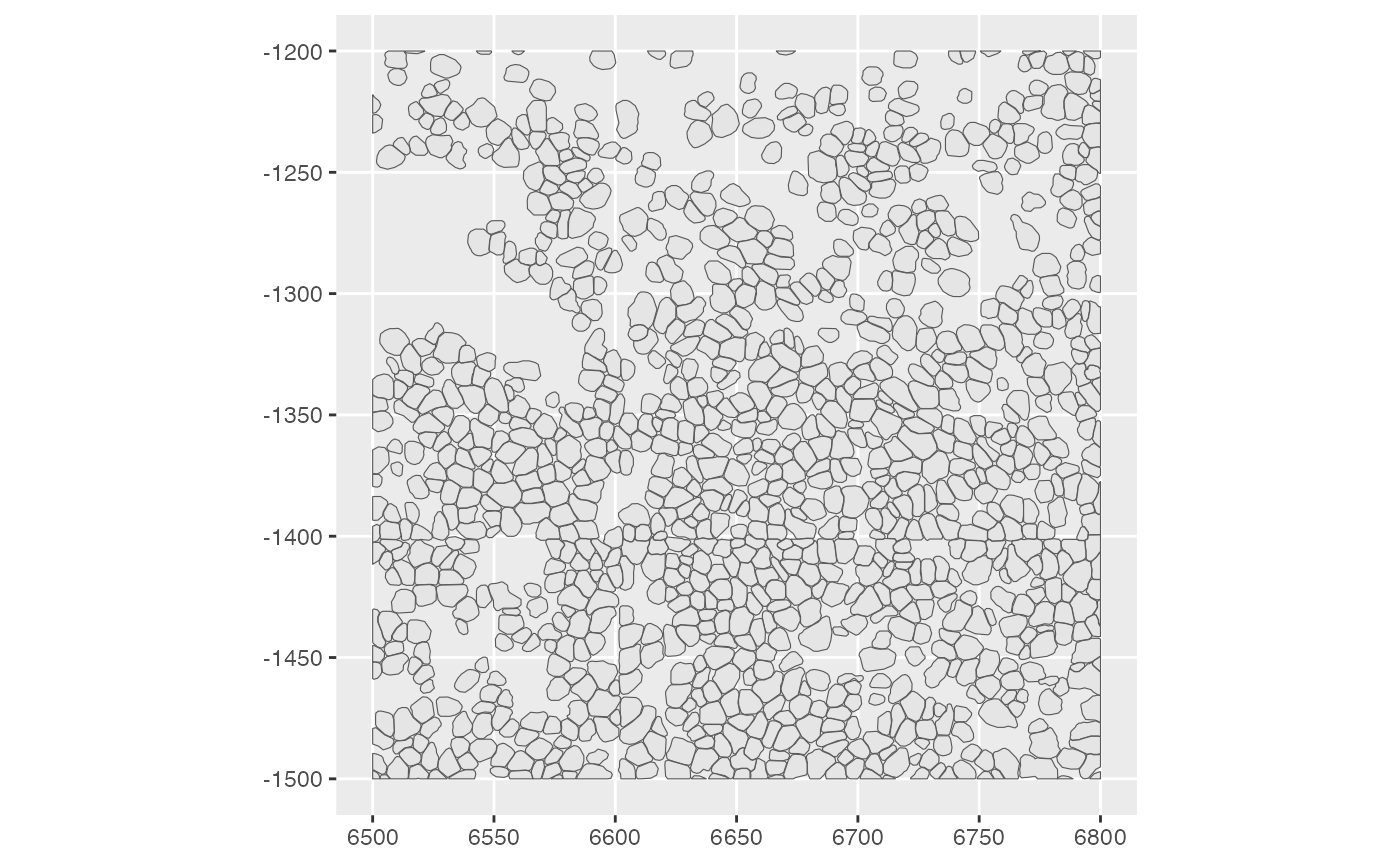
Plot converted Seurat to SFE - Vizgen
#options(repr.plot.height = 5, repr.plot.width = 10)
plotSpatialFeature(sfe_conv_vz, exprs_values = "counts",
                   features = rownames(sfe_conv_vz)[1],
                   size = 4, colGeometryName = "cellSeg",
                   dark = TRUE, #show_axes = T,
                   #sample_id = "",
                   scattermore = FALSE
                  )
Test when Seurat object has > 1 Assay - Xenium
sfe_conv_xen2 <-
  toSpatialFeatureExperiment(x = obj_xen,
                             add_molecules = FALSE,
                             flip = "geometry",
                             unit = "micron",
                             BPPARAM = BPPARAM
                             )
## >>> Seurat Assays found: Xenium, BlankCodeword, ControlCodeword, ControlProbe
## >>> Xenium -> will be used as 'Main Experiment'## >>> Seurat spatial FOVs found:
## centroids
## segmentation
## molecules## >>> Generating `sf` geometries## Warning: Layer 'scale.data' is empty##
## >>> Creating `SFE` object -> xen.toy.1## >>> Adding Seurat Assay(s) as Alternative Experiment(s):
## BlankCodeword
## ControlCodeword
## ControlProbe## Warning: Layer 'scale.data' is empty
## Layer 'scale.data' is empty
## Layer 'scale.data' is empty
sfe_conv_xen2## class: SpatialFeatureExperiment
## dim: 27 16324
## metadata(0):
## assays(2): counts logcounts
## rownames(27): AKT1 ALDH1A2 ... SNHG32 SPIB
## rowData names(0):
## colnames(16324): aaacmono-1 aaaekabk-1 ... ojeogmfc-1 ojfcjbep-1
## colData names(10): orig.ident nCount_Xenium ... nFeature_ControlProbe
## sample_id
## reducedDimNames(0):
## mainExpName: Xenium
## altExpNames(3): BlankCodeword ControlCodeword ControlProbe
## spatialCoords names(2) : X Y
## imgData names(0):
##
## unit: micron
## Geometries:
## colGeometries: centroids (POINT), cellSeg (POLYGON)
##
## Graphs:
## xen_toy_1:
getMeta(sfe_conv_xen2) %>% str## 'data.frame': 16324 obs. of 10 variables:
## $ orig.ident : chr "xen.toy.1" "xen.toy.1" "xen.toy.1" "xen.toy.1" ...
## $ nCount_Xenium : num 94 12 174 60 158 44 88 80 15 84 ...
## $ nFeature_Xenium : int 20 6 20 15 17 14 19 16 9 15 ...
## $ nCount_BlankCodeword : num 0 0 0 0 0 0 1 0 0 0 ...
## $ nFeature_BlankCodeword : int 0 0 0 0 0 0 1 0 0 0 ...
## $ nCount_ControlCodeword : num 0 0 0 0 0 0 0 0 0 0 ...
## $ nFeature_ControlCodeword: int 0 0 0 0 0 0 0 0 0 0 ...
## $ nCount_ControlProbe : num 0 0 0 0 0 0 0 0 0 0 ...
## $ nFeature_ControlProbe : int 0 0 0 0 0 0 0 0 0 0 ...
## $ sample_id : chr "xen_toy_1" "xen_toy_1" "xen_toy_1" "xen_toy_1" ...
getMeta(obj_xen) %>% str## 'data.frame': 16324 obs. of 9 variables:
## $ orig.ident : chr "xen.toy.1" "xen.toy.1" "xen.toy.1" "xen.toy.1" ...
## $ nCount_Xenium : num 94 12 174 60 158 44 88 80 15 84 ...
## $ nFeature_Xenium : int 20 6 20 15 17 14 19 16 9 15 ...
## $ nCount_BlankCodeword : num 0 0 0 0 0 0 1 0 0 0 ...
## $ nFeature_BlankCodeword : int 0 0 0 0 0 0 1 0 0 0 ...
## $ nCount_ControlCodeword : num 0 0 0 0 0 0 0 0 0 0 ...
## $ nFeature_ControlCodeword: int 0 0 0 0 0 0 0 0 0 0 ...
## $ nCount_ControlProbe : num 0 0 0 0 0 0 0 0 0 0 ...
## $ nFeature_ControlProbe : int 0 0 0 0 0 0 0 0 0 0 ...Plot converted Seurat to SFE with several altExp -
Xenium
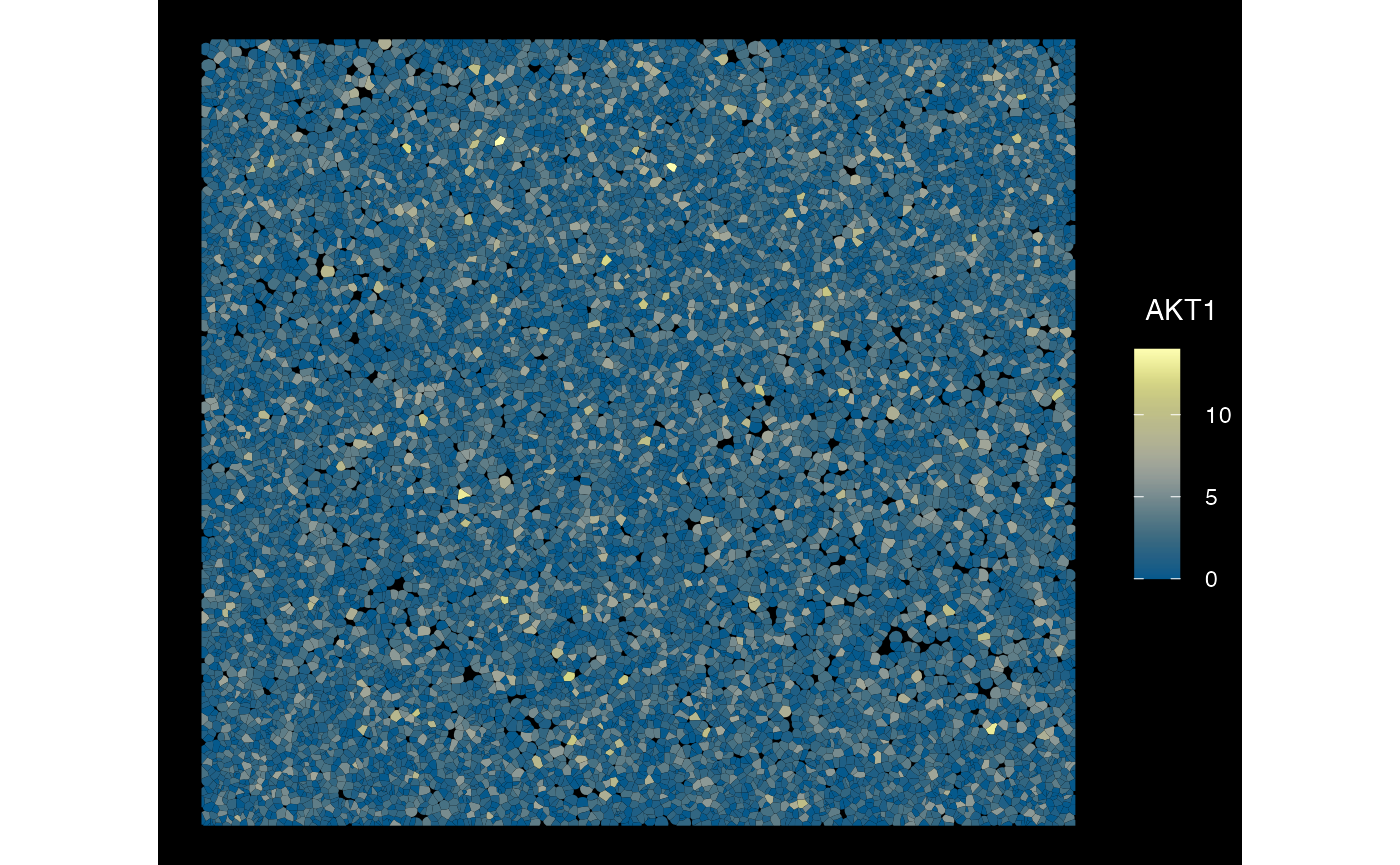
plotSpatialFeature(sfe_conv_xen2, exprs_values = "counts",
                   features = rownames(sfe_conv_xen2)[1],
                   size = 1, colGeometryName = "cellSeg",
                   dark = TRUE,
                   #sample_id = "",
                   scattermore = FALSE
                  )
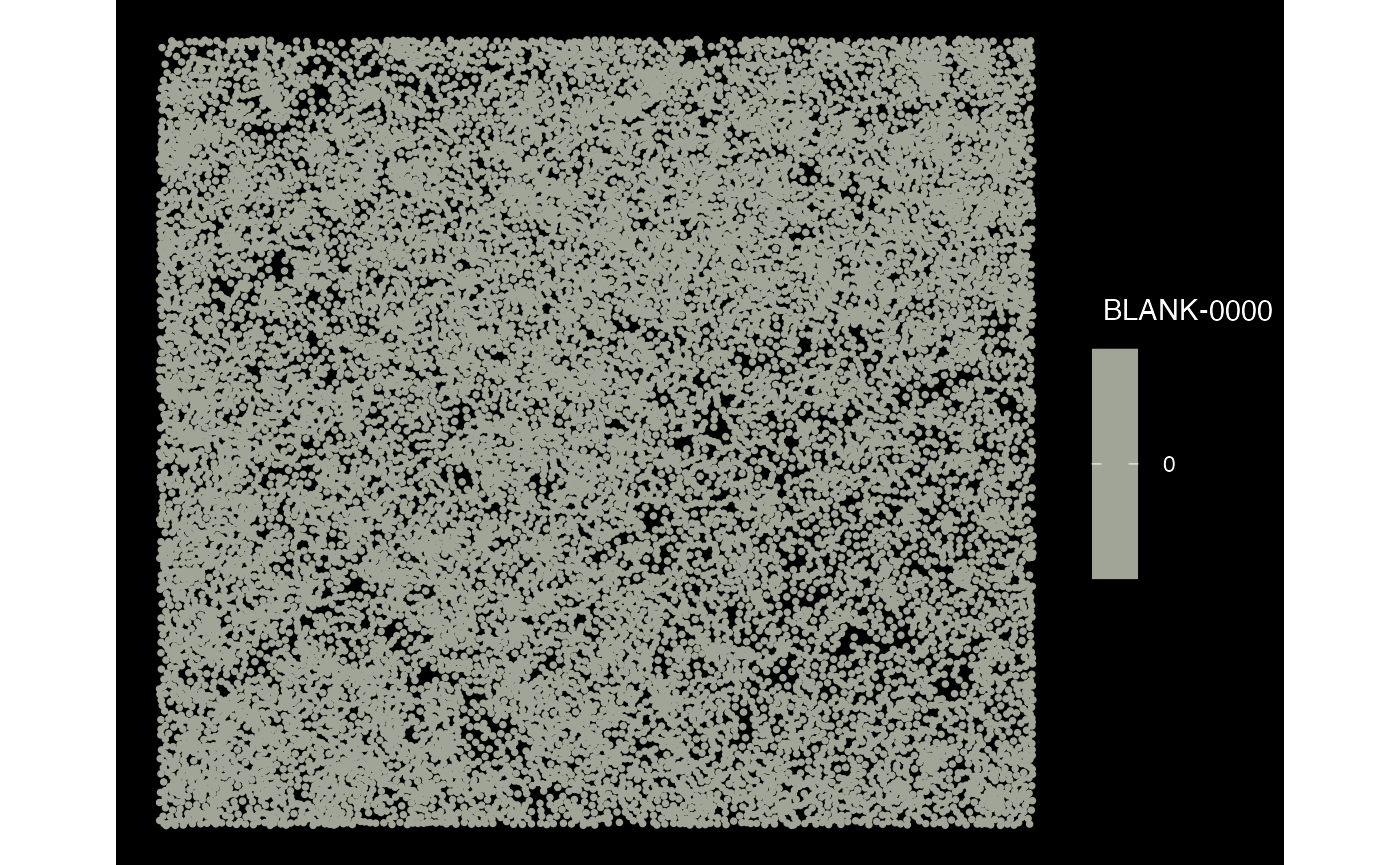
Plot one of the altExp - Xenium
plotSpatialFeature(altExp(sfe_conv_xen2, 1), exprs_values = "counts",
                   features = rownames(altExp(sfe_conv_xen2, 1))[1],
                   size = 1, colGeometryName = "centroids",
                   dark = TRUE,
                   #sample_id = "",
                   scattermore = FALSE # will plot only centroids!
)
Test when Seurat object has > 1 Assay - Vizgen
eg including SCT Assays, as well as PCA, UMAP embedding etc..
# normalize data
obj_vz %<>%
    SCTransform(assay = DefaultAssay(obj_vz), verbose = F) %>%
    RunPCA(npcs = 5, verbose = F) %>%
    RunUMAP(dims = 1:5, verbose = F)
## `vst.flavor` is set to 'v2' but could not find glmGamPoi installed.
## Please install the glmGamPoi package for much faster estimation.
## --------------------------------------------
## install.packages('BiocManager')
## BiocManager::install('glmGamPoi')
## --------------------------------------------
## Falling back to native (slower) implementation.## Warning: The default method for RunUMAP has changed from calling Python UMAP via reticulate to the R-native UWOT using the cosine metric
## To use Python UMAP via reticulate, set umap.method to 'umap-learn' and metric to 'correlation'
## This message will be shown once per session
obj_vz## An object of class Seurat
## 98 features across 1058 samples within 2 assays
## Active assay: SCT (49 features, 49 variable features)
## 3 layers present: counts, data, scale.data
## 1 other assay present: Vizgen
## 2 dimensional reductions calculated: pca, umap
## 1 spatial field of view present: vz.toy.1
sfe_conv_vz2 <-
  toSpatialFeatureExperiment(x = obj_vz,
                             add_molecules = FALSE,
                             flip = "geometry",
                             unit = "micron",
                             BPPARAM = BPPARAM
                             )
## >>> Seurat Assays found: Vizgen, SCT
## >>> SCT -> will be used as 'Main Experiment'## >>> Seurat spatial FOVs found:
## centroids
## segmentation
## molecules## >>> Generating `sf` geometries##
## >>> Creating `SFE` object -> vz.toy.1## >>> Adding Dimensionality Reduction: pca, umap## >>> Adding Seurat Assay(s) as Alternative Experiment(s):
## Vizgen## Warning: Layer 'scale.data' is empty
sfe_conv_vz2## class: SpatialFeatureExperiment
## dim: 49 1046
## metadata(0):
## assays(3): counts logcounts scaledata
## rownames(49): CD4 TLL1 ... SRC HLA-DRB1
## rowData names(0):
## colnames(1046): 112824700230101253 112824700230101254 ...
## 112824700330100920 112824700330100974
## colData names(9): orig.ident nCount_Vizgen ... nFeature_SCT sample_id
## reducedDimNames(2): PCA UMAP
## mainExpName: SCT
## altExpNames(1): Vizgen
## spatialCoords names(2) : X Y
## imgData names(0):
##
## unit: micron
## Geometries:
## colGeometries: centroids (POINT), cellSeg (POLYGON)
##
## Graphs:
## vz_toy_1:
getMeta(sfe_conv_vz2) %>% str## 'data.frame': 1046 obs. of 9 variables:
## $ orig.ident : chr "vz.toy.1" "vz.toy.1" "vz.toy.1" "vz.toy.1" ...
## $ nCount_Vizgen : num 60 127 107 55 165 14 38 74 33 42 ...
## $ nFeature_Vizgen: int 19 25 26 19 24 8 16 14 13 14 ...
## $ z : int 3 3 3 3 3 3 3 3 3 3 ...
## $ volume : num 839 803 527 461 584 ...
## $ fov : logi NA NA NA NA NA NA ...
## $ nCount_SCT : num 60 60 63 57 61 52 55 62 55 56 ...
## $ nFeature_SCT : int 19 18 24 19 13 13 16 14 13 14 ...
## $ sample_id : chr "vz_toy_1" "vz_toy_1" "vz_toy_1" "vz_toy_1" ...Check reducedDim
ElbowPlot(sfe_conv_vz2, ndims = 5)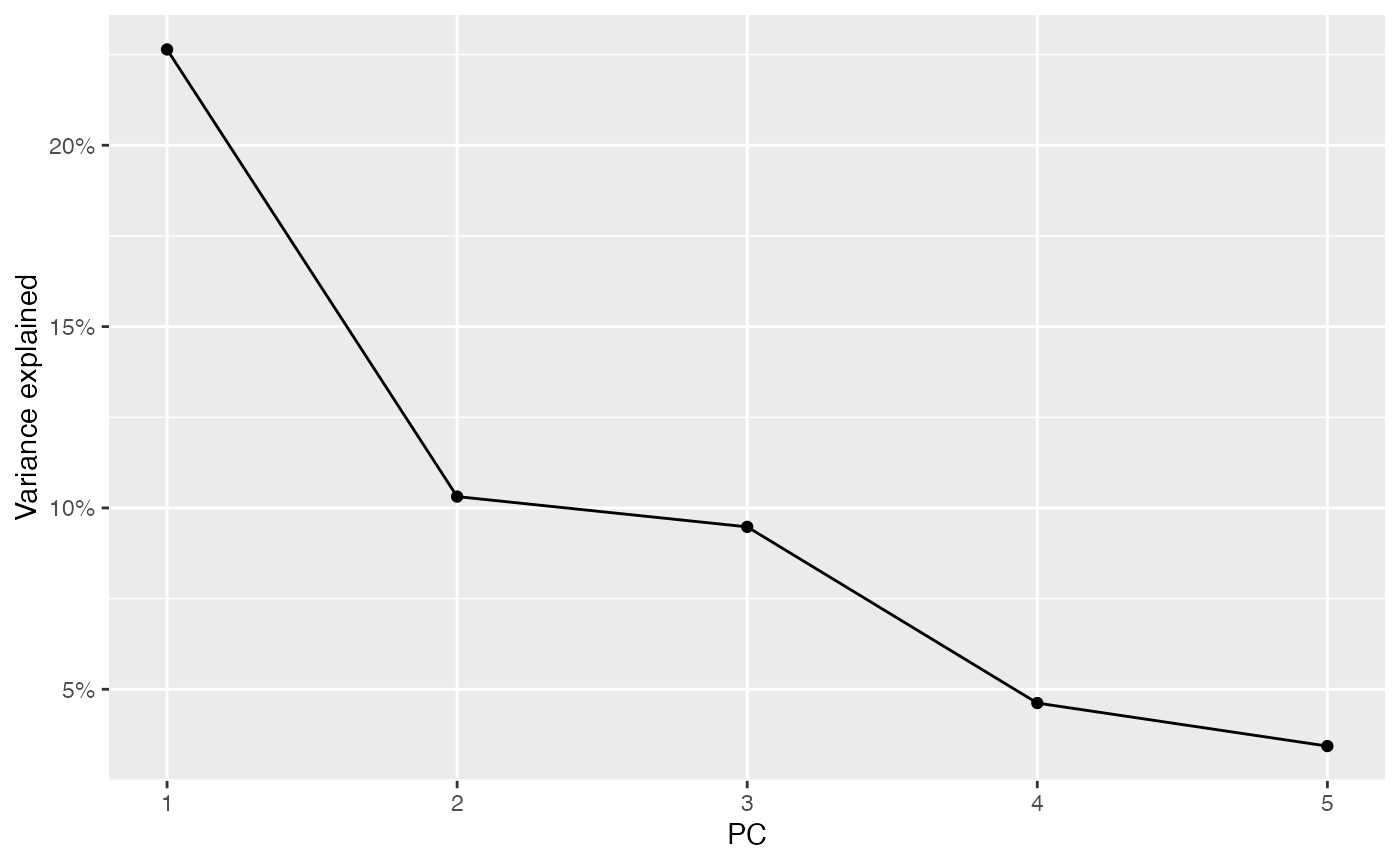
plotDimLoadings(sfe_conv_vz2, dims = 1:5, nfeatures = 5, reduction = "PCA")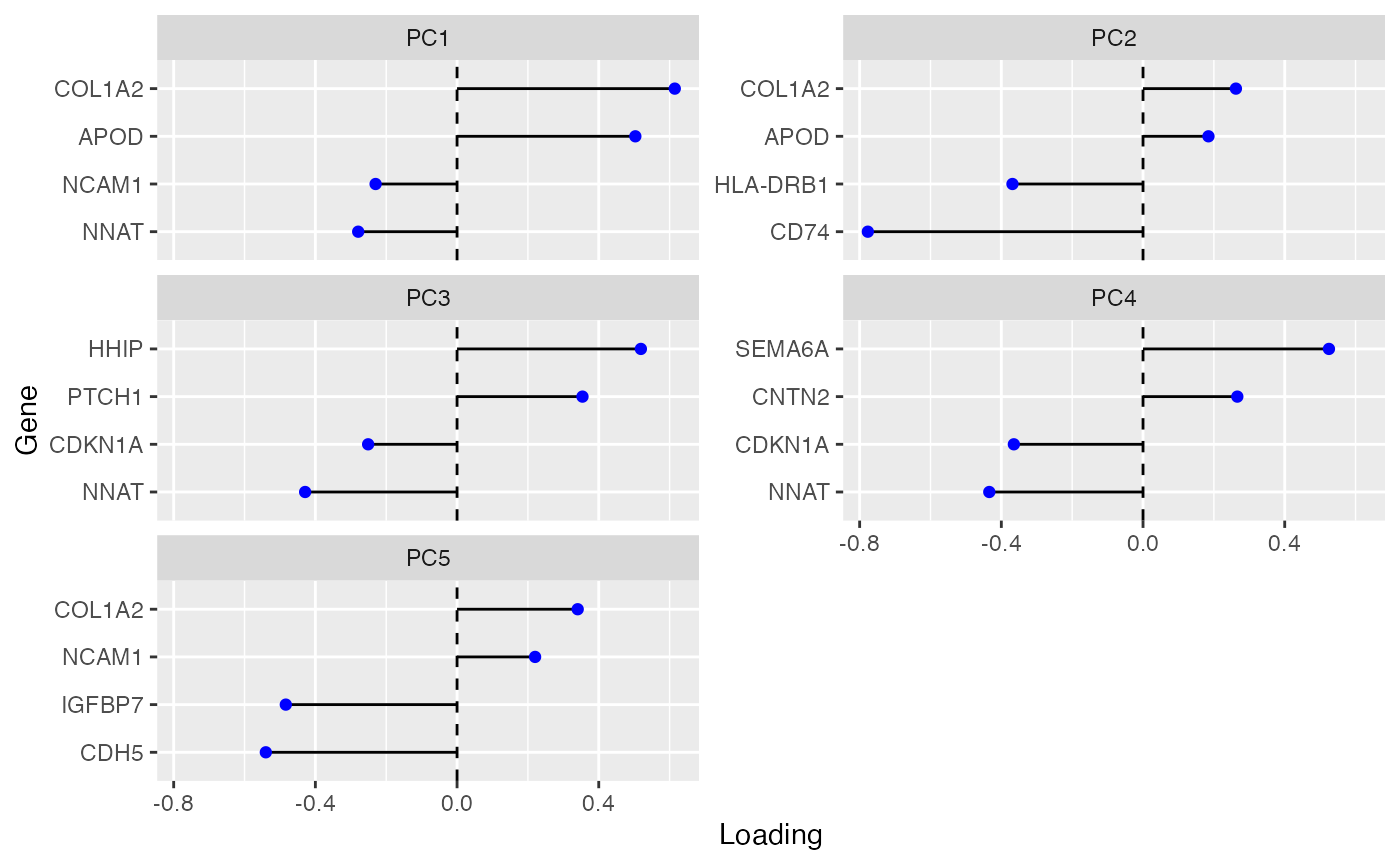
Load Seurat objects with several samples/FOVs
obj_vz_multi <- SeuratTestData("VizgenMulti") # Vizgen## see ?SFEData and browseVignettes('SFEData') for documentation## downloading 1 resources## retrieving 1 resource## loading from cache
obj_vz_multi## An object of class Seurat
## 49 features across 1058 samples within 1 assay
## Active assay: Vizgen (49 features, 0 variable features)
## 2 layers present: counts, data
## 2 spatial fields of view present: vz.toy.1 vz.toy.2
obj_xen_multi <- SeuratTestData("XeniumMulti") # Xenium## see ?SFEData and browseVignettes('SFEData') for documentation## downloading 1 resources## retrieving 1 resource## loading from cache
obj_xen_multi## An object of class Seurat
## 541 features across 16324 samples within 4 assays
## Active assay: Xenium (27 features, 0 variable features)
## 2 layers present: counts, data
## 3 other assays present: BlankCodeword, ControlCodeword, ControlProbe
## 2 spatial fields of view present: xen.toy.1 xen.toy.2## An object of class Seurat
## 5 features across 25 samples within 1 assay
## Active assay: RNA (5 features, 0 variable features)
## 2 layers present: counts.1, counts.2
## 2 images present: sample01, sample02
obj_vishd_multi <- SeuratTestData("VisiumHDmulti") # Visium HD## see ?SFEData and browseVignettes('SFEData') for documentation## downloading 1 resources## retrieving 1 resource## loading from cache
obj_vishd_multi## An object of class Seurat
## 100 features across 492460 samples within 2 assays
## Active assay: Spatial.008um (50 features, 0 variable features)
## 2 layers present: counts, data
## 1 other assay present: Spatial.016um
## 2 spatial fields of view present: slice1.008um slice1.016umConvert multiple samples/FOVs - Visium
NOTE, the function will automatically check how many FOVs Seurat object has and combine those samples in a single SFE object
# toy Visium data
sfe_vis_multi <-
  toSpatialFeatureExperiment(x = obj_vis_multi,
                             image_scalefactors = "lowres",
                             unit = "micron",
                             BPPARAM = BPPARAM)
## >>> 2 spatial FOVs are found, each will be used as `sample_id`:
## sample01
## sample02## >>> Seurat Assays found: RNA
## >>> RNA -> will be used as 'Main Experiment'## >>> Seurat spatial object found: VisiumV1
## >>> 'full_res_image_pixel' units will be used ->
## ie 'imagerow' & 'imagecol' without scaling factors
## >>> set `unit = 'micron'` to convert spot coordinates to micron space## >>> Generating `sf` geometries## Warning: Layer 'data' is empty## Warning: Layer 'scale.data' is empty##
## >>> Creating `SFE` object -> sample01## >>> Converting pixels to microns## >>> Seurat Assays found: RNA
## >>> RNA -> will be used as 'Main Experiment'## >>> Seurat spatial object found: VisiumV1
## >>> 'full_res_image_pixel' units will be used ->
## ie 'imagerow' & 'imagecol' without scaling factors
## >>> set `unit = 'micron'` to convert spot coordinates to micron space## >>> Generating `sf` geometries## Warning: Layer 'data' is empty
## Layer 'scale.data' is empty##
## >>> Creating `SFE` object -> sample02## >>> Converting pixels to microns## >>> Combining 2 SFE object(s) with unique `sample_id`
sfe_vis_multi## class: SpatialFeatureExperiment
## dim: 5 25
## metadata(0):
## assays(1): counts
## rownames(5): ACPP KLK3 MSMB TGM4 TAGLN
## rowData names(0):
## colnames(25): GTGGCGTGCACCAGAG-1 GGTCCCATAACATAGA-1 ...
## TGCAATTTGGGCACGG-1 ATGCCAATCGCTCTGC-1
## colData names(7): orig.ident nCount_RNA ... in_tissue sample_id
## reducedDimNames(0):
## mainExpName: RNA
## altExpNames(0):
## spatialCoords names(2) : X Y
## imgData names(1): sample_id
##
## unit: micron
## Geometries:
## colGeometries: spotPoly (POLYGON)
##
## Graphs:
## sample01:
## sample02:
getMeta(sfe_vis_multi) %>% str## 'data.frame': 25 obs. of 7 variables:
## $ orig.ident : chr "SeuratProject" "SeuratProject" "SeuratProject" "SeuratProject" ...
## $ nCount_RNA : num 165 118 122 709 375 521 167 148 73 137 ...
## $ nFeature_RNA: int 5 5 5 5 5 5 5 5 5 5 ...
## $ array_row : int 1 1 1 3 2 3 3 5 4 5 ...
## $ array_col : int 101 103 105 101 102 103 105 101 102 103 ...
## $ in_tissue : logi TRUE TRUE TRUE TRUE TRUE TRUE ...
## $ sample_id : chr "sample01" "sample01" "sample01" "sample01" ...Plot several samples - Visium
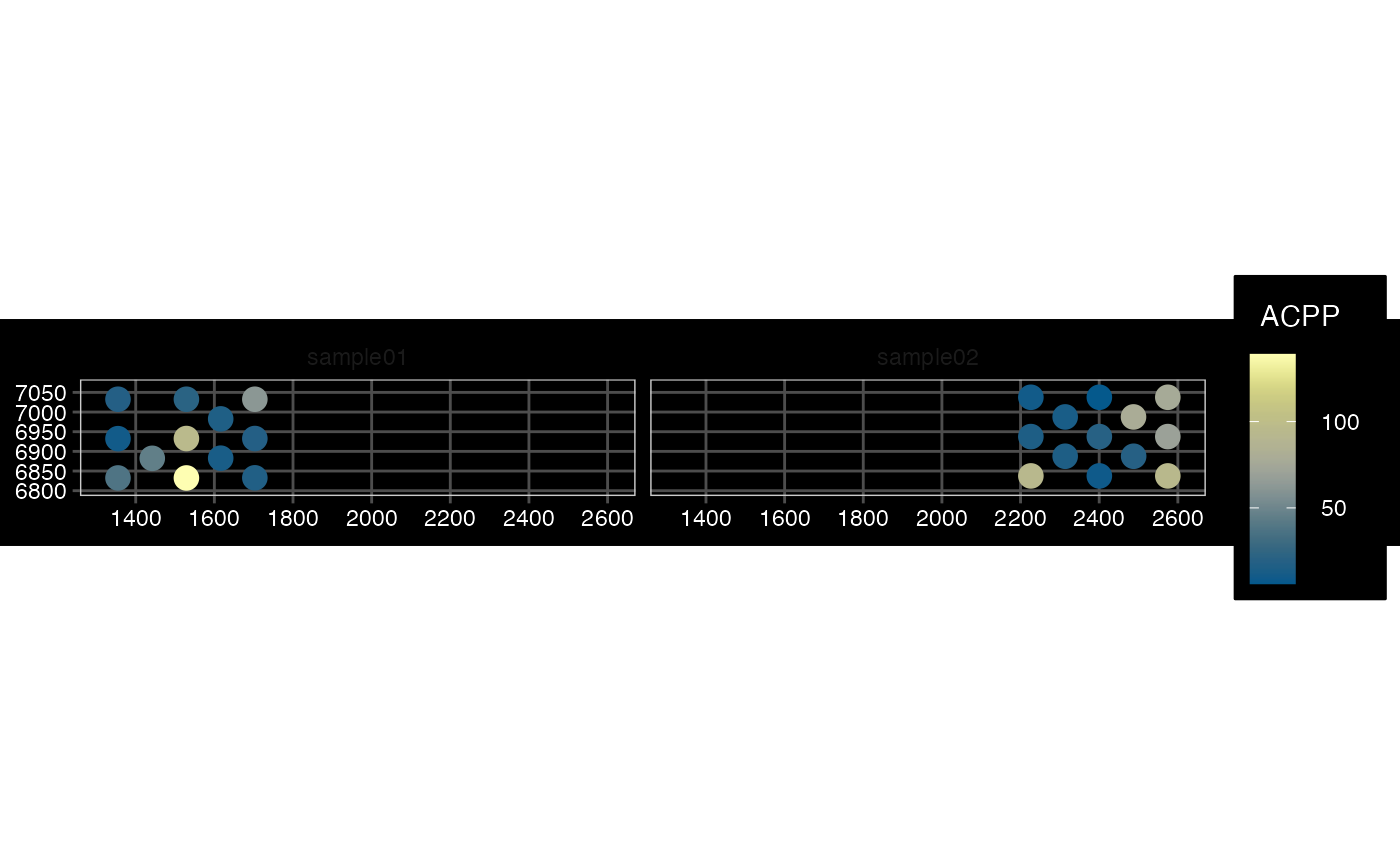
plotSpatialFeature(sfe_vis_multi, exprs_values = "counts",
                   features = rownames(sfe_vis_multi)[1],
                   #size = 1, colGeometryName = "spotPoly",
                   dark = TRUE,
                   show_axes = TRUE,
                   #sample_id = "",
                   scattermore = FALSE
                  )
TODO: Convert multiple samples/FOVs - Visium HD
sfe_vishd_multi <-
  toSpatialFeatureExperiment(x = obj_vishd_multi,
                             image_scalefactors = "lowres",
                             unit = "micron",
                             BPPARAM = BPPARAM)
## >>> 2 spatial FOVs are found, each will be used as `sample_id`:
## slice1.008um
## slice1.016um## >>> Seurat Assays found: Spatial.008um, Spatial.016um
## >>> Spatial.008um -> will be used as 'Main Experiment'## >>> Generating `sf` geometries## >>> Seurat spatial object found: VisiumV2 -> VisiumHD## >>> Making POLYGON geometry for bin size: 8 μm with total of 393543 cells, this can take some time!## Warning: Layer 'scale.data' is empty##
## >>> Creating `SFE` object -> slice1.008um## >>> Converting pixels to microns## >>> Seurat Assays found: Spatial.008um, Spatial.016um
## >>> Spatial.016um -> will be used as 'Main Experiment'## >>> Generating `sf` geometries## >>> Seurat spatial object found: VisiumV2 -> VisiumHD## >>> Making POLYGON geometry for bin size: 16 μm with total of 98917 cells, this can take some time!## Warning: Layer 'data' is empty
## Layer 'scale.data' is empty##
## >>> Creating `SFE` object -> slice1.016um## >>> Converting pixels to microns## >>> Combining 2 SFE object(s) with unique `sample_id`## >>> Only following assay(s) are identical and will be kept:
## counts
sfe_vishd_multi## class: SpatialFeatureExperiment
## dim: 50 492460
## metadata(0):
## assays(1): counts
## rownames(50): Xkr4 Rp1 ... Gdap1 Pi15
## rowData names(0):
## colnames(492460): s_008um_00301_00321-1 s_008um_00602_00290-1 ...
## s_016um_00144_00329-1 s_016um_00176_00108-1
## colData names(6): orig.ident nCount_Spatial.008um ...
## nFeature_Spatial.016um sample_id
## reducedDimNames(0):
## mainExpName: Spatial.008um
## altExpNames(0):
## spatialCoords names(2) : X Y
## imgData names(1): sample_id
##
## unit: micron
## Geometries:
## colGeometries: spotPoly (POLYGON)
##
## Graphs:
## slice1_008um:
## slice1_016um:
getMeta(sfe_vishd_multi) %>% str## 'data.frame': 492460 obs. of 6 variables:
## $ orig.ident : chr "s" "s" "s" "s" ...
## $ nCount_Spatial.008um : num 0 1 3 3 0 0 1 1 0 2 ...
## $ nFeature_Spatial.008um: int 0 1 3 3 0 0 1 1 0 2 ...
## $ nCount_Spatial.016um : num NA NA NA NA NA NA NA NA NA NA ...
## $ nFeature_Spatial.016um: int NA NA NA NA NA NA NA NA NA NA ...
## $ sample_id : chr "slice1_008um" "slice1_008um" "slice1_008um" "slice1_008um" ...Plot several samples - Visium HD
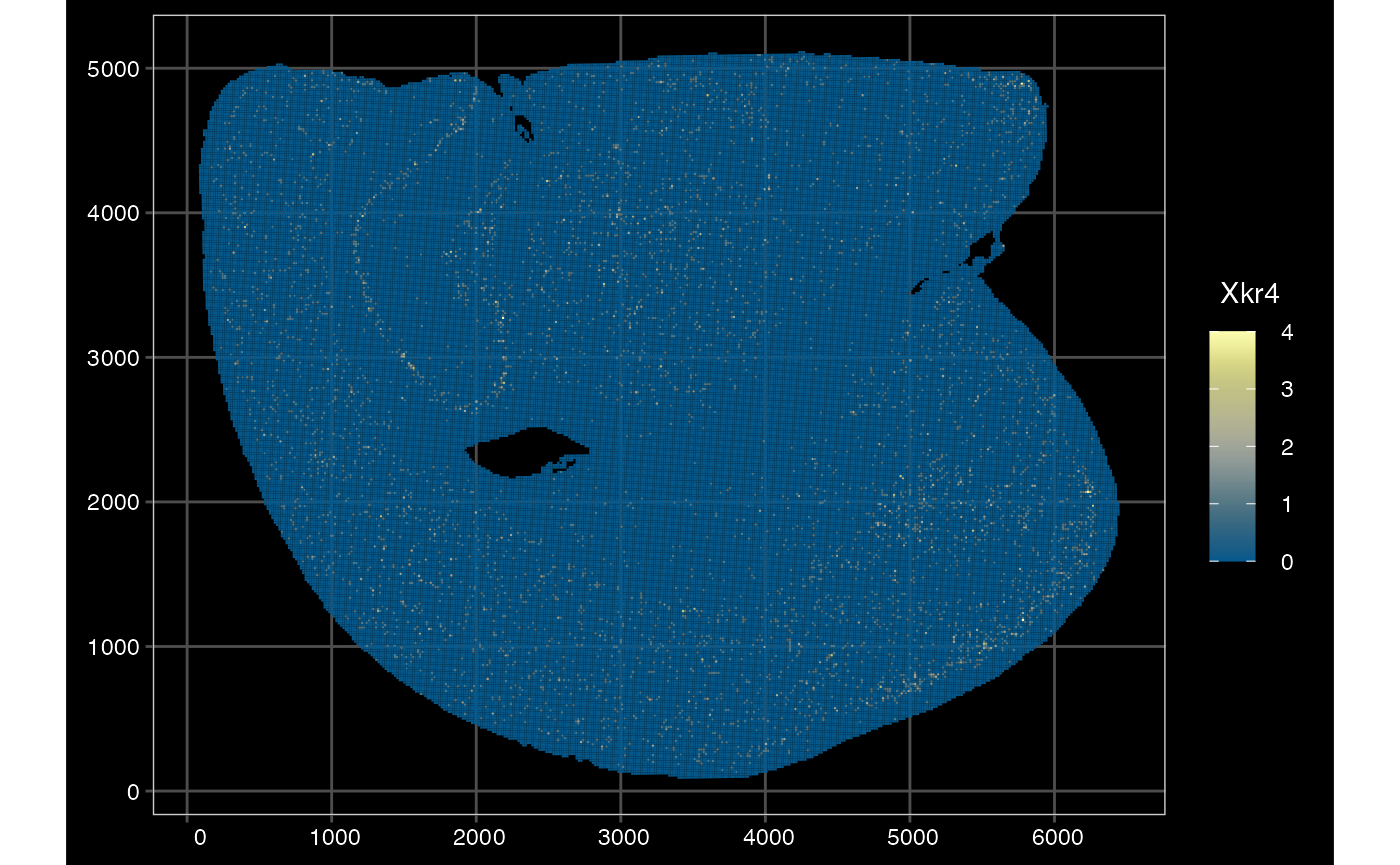
plotSpatialFeature(sfe_vishd_multi, exprs_values = "counts",
                   features = rownames(sfe_vishd_multi)[1],
                   #size = 1, colGeometryName = "spotPoly",
                   dark = TRUE,
                   show_axes = TRUE,
                   sample_id = sampleIDs(sfe_vishd_multi)[1],
                   scattermore = TRUE
                  )
## scattermore and binning only apply to points. Using centroids.
# 16 microns better plotted using polygons
plotSpatialFeature(sfe_vishd_multi, exprs_values = "counts",
                   features = rownames(sfe_vishd_multi)[1],
                   size = 0, colGeometryName = "spotPoly",
                   dark = TRUE,
                   show_axes = TRUE,
                   sample_id = sampleIDs(sfe_vishd_multi)[2],
                   scattermore = FALSE
                  )
Convert multiple samples/FOVs - Xenium
# slim down Xenium obj to keep only 1 Assay
if (!exists("obj_xen_multi.slim"))
  obj_xen_multi.slim <- DietSeurat(obj_xen_multi, assays = "Xenium")
#real data subset
sfe_xen_multi <-
  toSpatialFeatureExperiment(x = obj_xen_multi.slim,
                             add_molecules = FALSE,
                             flip = "geometry",
                             #unit = "micron",
                             BPPARAM = BPPARAM
                             )
## >>> 2 spatial FOVs are found, each will be used as `sample_id`:
## xen.toy.1
## xen.toy.2## >>> Seurat Assays found: Xenium
## >>> Xenium -> will be used as 'Main Experiment'## >>> Seurat spatial FOVs found:
## centroids
## segmentation
## molecules## >>> Generating `sf` geometries## Warning: Layer 'scale.data' is empty##
## >>> Creating `SFE` object -> xen.toy.1## >>> Seurat Assays found: Xenium
## >>> Xenium -> will be used as 'Main Experiment'## >>> Seurat spatial FOVs found:
## centroids
## segmentation
## molecules## >>> Generating `sf` geometries## Warning: Layer 'scale.data' is empty##
## >>> Creating `SFE` object -> xen.toy.2## >>> Combining 2 SFE object(s) with unique `sample_id`
sfe_xen_multi## class: SpatialFeatureExperiment
## dim: 27 16324
## metadata(0):
## assays(2): counts logcounts
## rownames(27): AKT1 ALDH1A2 ... SNHG32 SPIB
## rowData names(0):
## colnames(16324): aaacmono-1 aaafcgif-1 ... kfphpbkd-1 npoabajl-1
## colData names(10): orig.ident nCount_Xenium ... nFeature_ControlProbe
## sample_id
## reducedDimNames(0):
## mainExpName: Xenium
## altExpNames(0):
## spatialCoords names(2) : X Y
## imgData names(1): sample_id
##
## unit: micron
## Geometries:
## colGeometries: centroids (POINT), cellSeg (POLYGON)
##
## Graphs:
## xen_toy_1:
## xen_toy_2:
getMeta(sfe_xen_multi) %>% str## 'data.frame': 16324 obs. of 10 variables:
## $ orig.ident : chr "xen.toy.1" "xen.toy.1" "xen.toy.1" "xen.toy.1" ...
## $ nCount_Xenium : num 94 174 44 88 15 84 31 48 177 111 ...
## $ nFeature_Xenium : int 20 20 14 19 9 15 13 13 18 19 ...
## $ nCount_BlankCodeword : num 0 0 0 1 0 0 0 0 0 0 ...
## $ nFeature_BlankCodeword : int 0 0 0 1 0 0 0 0 0 0 ...
## $ nCount_ControlCodeword : num 0 0 0 0 0 0 0 0 0 0 ...
## $ nFeature_ControlCodeword: int 0 0 0 0 0 0 0 0 0 0 ...
## $ nCount_ControlProbe : num 0 0 0 0 0 0 0 0 0 0 ...
## $ nFeature_ControlProbe : int 0 0 0 0 0 0 0 0 0 0 ...
## $ sample_id : chr "xen_toy_1" "xen_toy_1" "xen_toy_1" "xen_toy_1" ...Plot several samples - Xenium
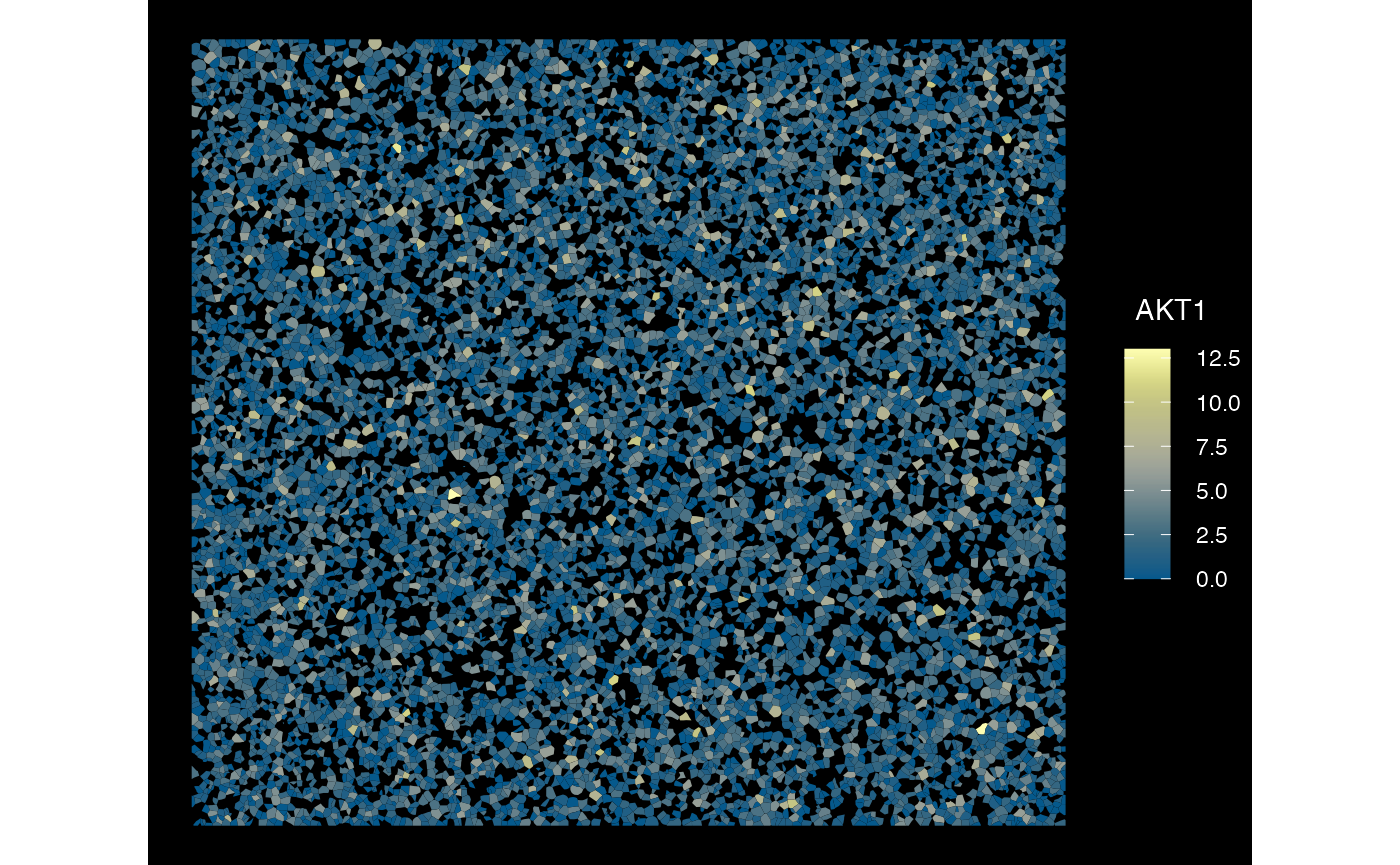
plotSpatialFeature(sfe_xen_multi, exprs_values = "counts",
                   features = rownames(sfe_xen_multi)[1],
                   size = 1, colGeometryName = "cellSeg",
                   dark = TRUE,
                   sample_id = sampleIDs(sfe_xen_multi)[1],
                   scattermore = FALSE
                  )
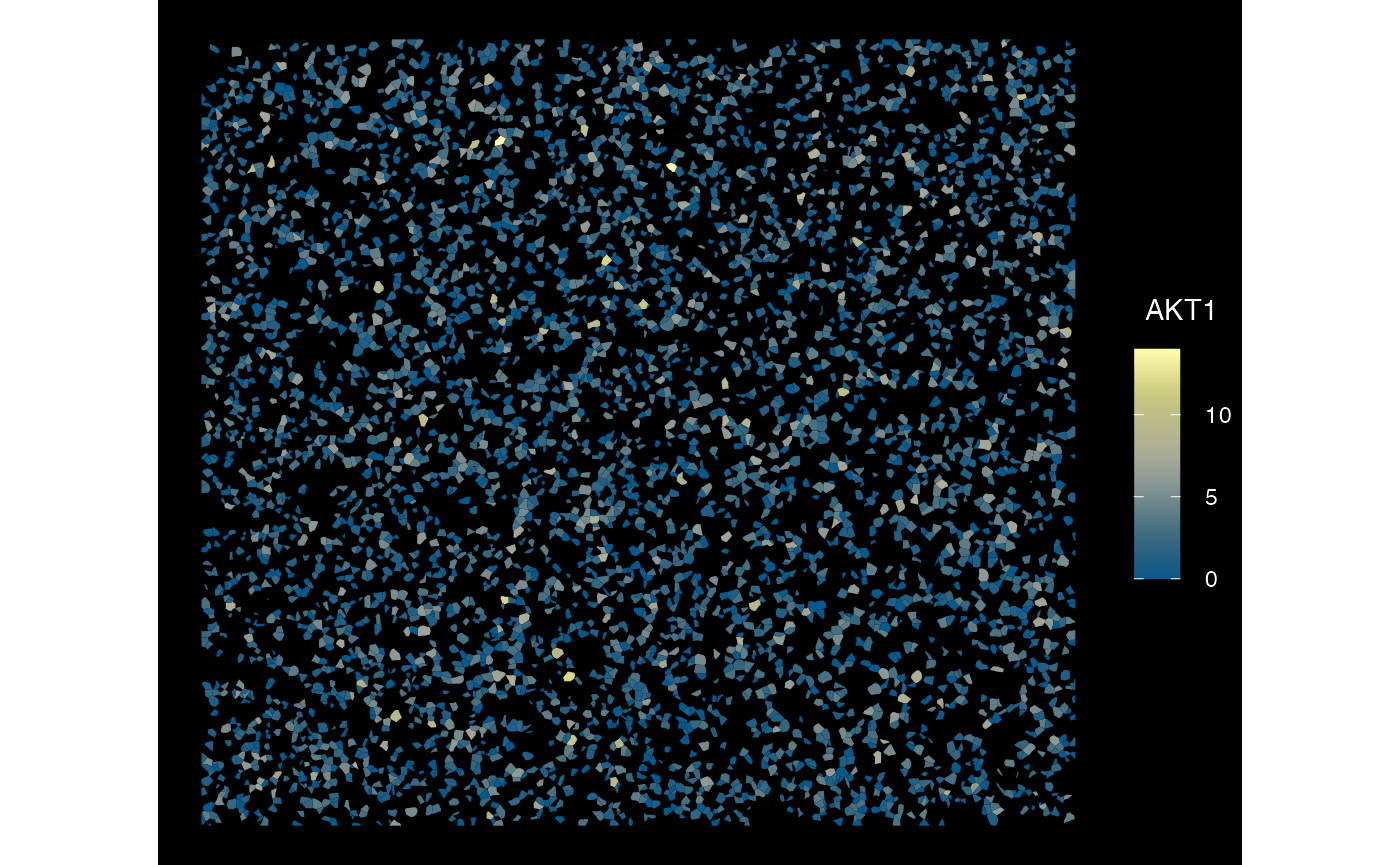
plotSpatialFeature(sfe_xen_multi, exprs_values = "counts",
                   features = rownames(sfe_xen_multi)[1],
                   size = 1, colGeometryName = "cellSeg",
                   dark = TRUE,
                   sample_id = sampleIDs(sfe_xen_multi)[2],
                   scattermore = FALSE
                  )
Convert multiple samples/FOVs - Vizgen
sfe_vz_multi <-
  toSpatialFeatureExperiment(x = obj_vz_multi,
                             add_molecules = FALSE,
                             flip = "geometry",
                             #unit = "micron",
                             BPPARAM = BPPARAM)
## >>> 2 spatial FOVs are found, each will be used as `sample_id`:
## vz.toy.1
## vz.toy.2## >>> Seurat Assays found: Vizgen
## >>> Vizgen -> will be used as 'Main Experiment'## >>> Seurat spatial FOVs found:
## centroids
## segmentation
## molecules## >>> Generating `sf` geometries## Warning: Layer 'scale.data' is empty##
## >>> Creating `SFE` object -> vz.toy.1## >>> Seurat Assays found: Vizgen
## >>> Vizgen -> will be used as 'Main Experiment'## >>> Seurat spatial FOVs found:
## centroids
## segmentation
## molecules## >>> Generating `sf` geometries## Warning: Layer 'scale.data' is empty##
## >>> Creating `SFE` object -> vz.toy.2## >>> Combining 2 SFE object(s) with unique `sample_id`
sfe_vz_multi## class: SpatialFeatureExperiment
## dim: 49 1046
## metadata(0):
## assays(2): counts logcounts
## rownames(49): CD4 TLL1 ... SRC HLA-DRB1
## rowData names(0):
## colnames(1046): 112824700230101253 112824700230101265 ...
## 112824700230101970 112824700230101659
## colData names(7): orig.ident nCount_Vizgen ... fov sample_id
## reducedDimNames(0):
## mainExpName: Vizgen
## altExpNames(0):
## spatialCoords names(2) : X Y
## imgData names(1): sample_id
##
## unit: micron
## Geometries:
## colGeometries: centroids (POINT), cellSeg (POLYGON)
##
## Graphs:
## vz_toy_1:
## vz_toy_2:
getMeta(sfe_vz_multi) %>% str## 'data.frame': 1046 obs. of 7 variables:
## $ orig.ident : chr "vz.toy.1" "vz.toy.1" "vz.toy.1" "vz.toy.1" ...
## $ nCount_Vizgen : num 60 14 38 42 71 48 6 22 33 75 ...
## $ nFeature_Vizgen: int 19 8 16 14 15 19 5 12 11 19 ...
## $ z : int 3 3 3 3 3 3 3 3 3 3 ...
## $ volume : num 839 309 343 403 318 ...
## $ fov : logi NA NA NA NA NA NA ...
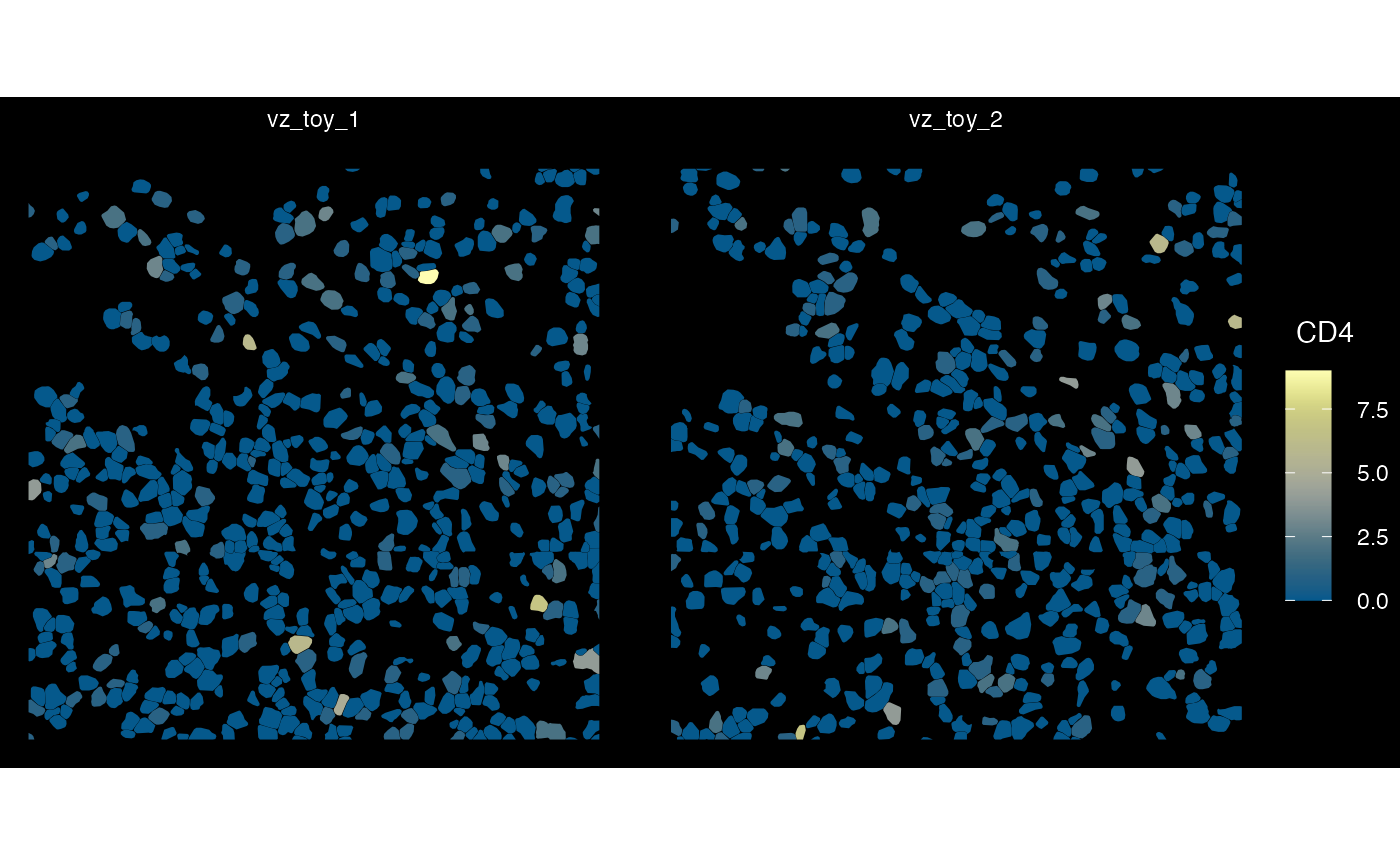
## $ sample_id : chr "vz_toy_1" "vz_toy_1" "vz_toy_1" "vz_toy_1" ...Plot several samples - Vizgen
plotSpatialFeature(sfe_vz_multi, exprs_values = "counts",
                   features = rownames(sfe_vz_multi)[1],
                   size = 4, colGeometryName = "cellSeg",
                   dark = TRUE, #show_axes = T,
                   #sample_id = "",
                   scattermore = FALSE
                  )