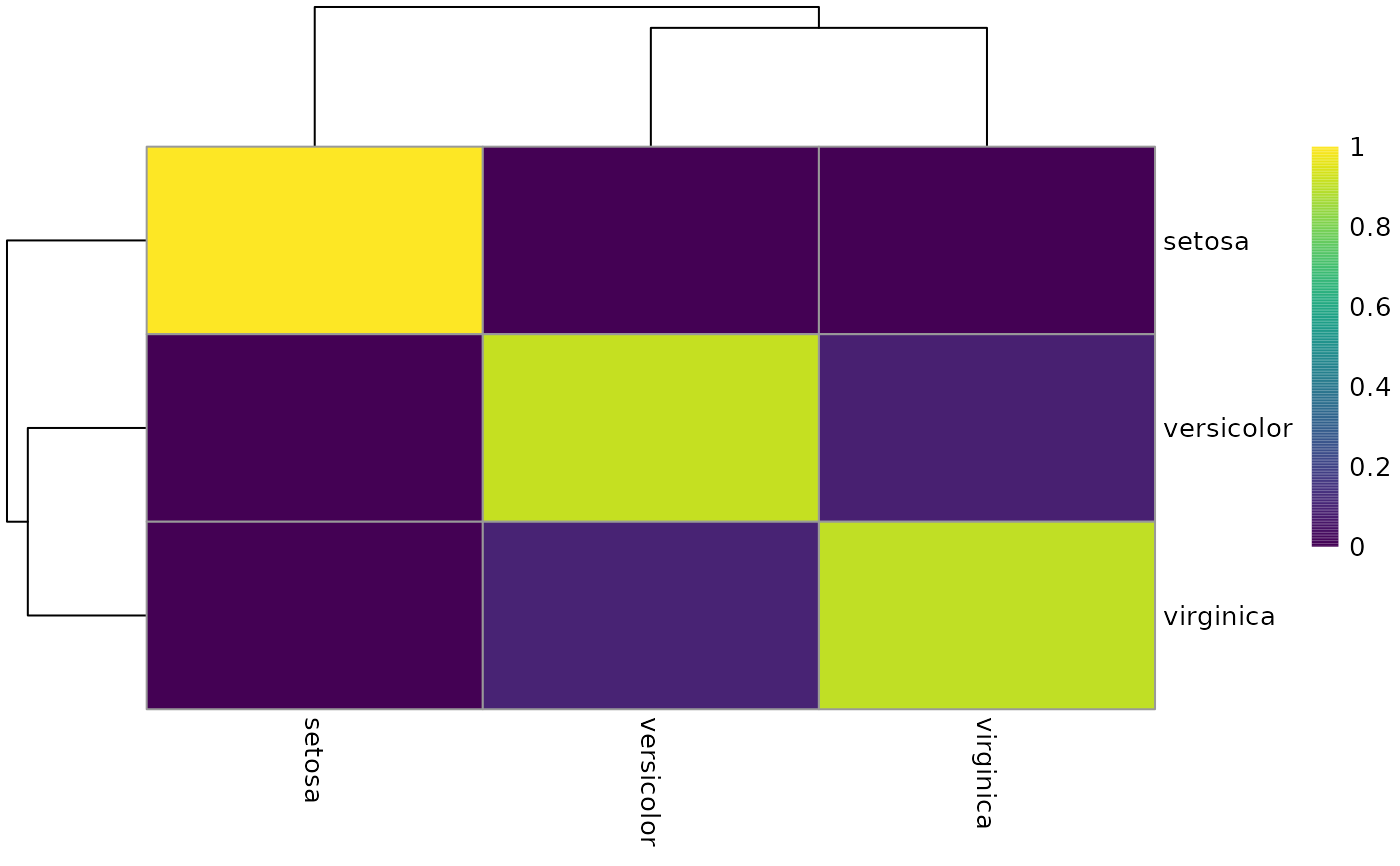
The calculateConcordex function returns a matrix showing the number of
cells of each label in the neighborhood of cells of each label when argument
return.map = TRUE. This function plots this matrix as a heatmap, which
can be used as a clustering diagnostic.
Arguments
- concordex
Output from
calculateConcordex.- ...
Other arguments passed to
pheatmapto customize the plot.
Examples
library(BiocNeighbors)
g <- findKNN(iris[, seq_len(4)], k = 10)
#> Warning: detected tied distances to neighbors, see ?'BiocNeighbors-ties'
res <- calculateConcordex(g$index,
    labels = iris$Species, k = 10,
    return.map = TRUE
)
heatConcordex(res)