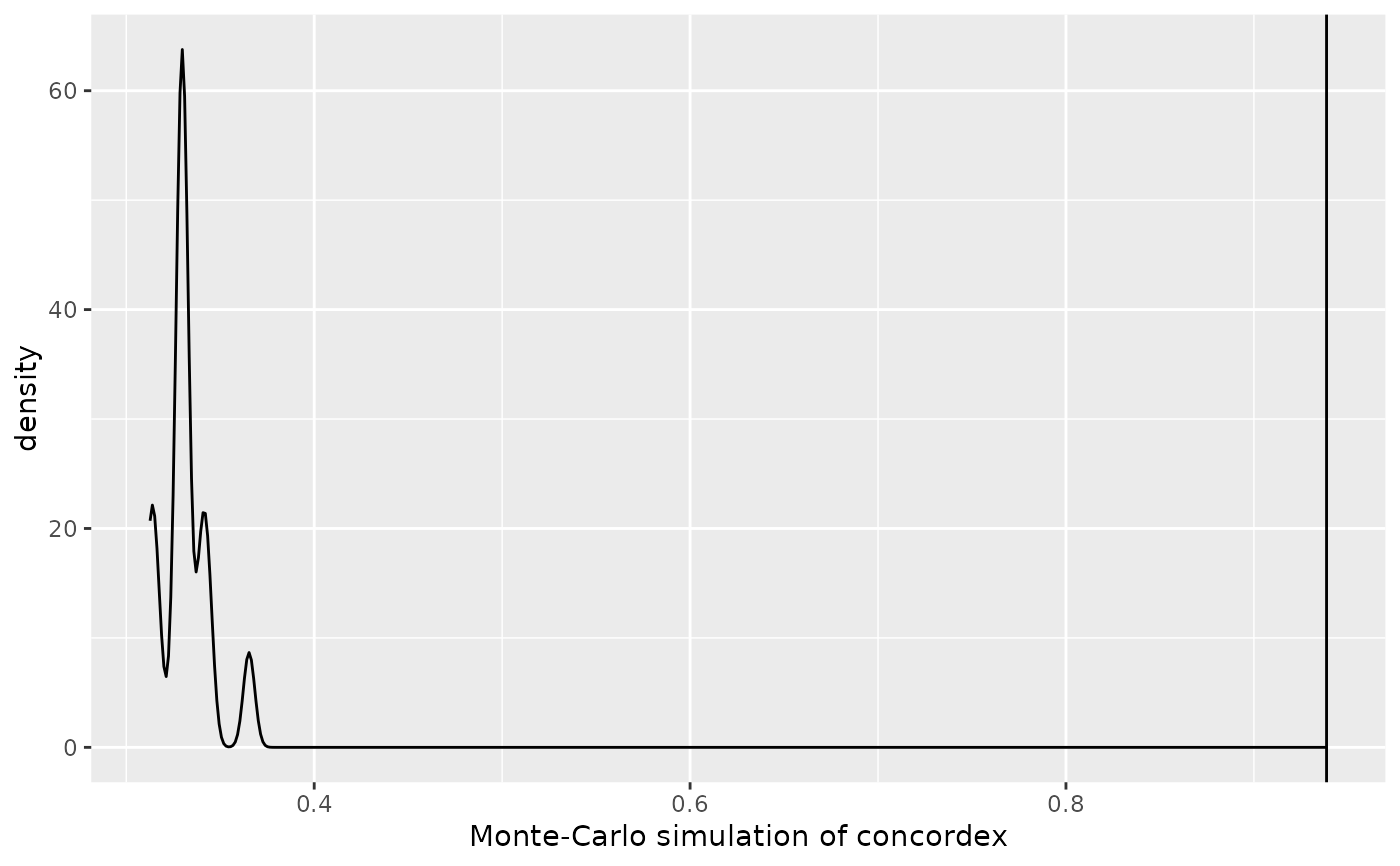
The concordex values from permuted labels represent the null distribution of the statistic. This can be plotted as a density plot and visually compared to the actual value.
Arguments
- concordex
Output from
calculateConcordex.- ...
Other arguments passed to
geom_density.
Value
A ggplot2 object. The density plot shows the simulated concordex coefficient from permuted labels, while the vertical line shows the actual concordex coefficient.
Examples
library(BiocNeighbors)
g <- findKNN(iris[, seq_len(4)], k = 10)
#> Warning: detected tied distances to neighbors, see ?'BiocNeighbors-ties'
res <- calculateConcordex(g$index, labels = iris$Species, k = 10)
plotConcordexSim(res)