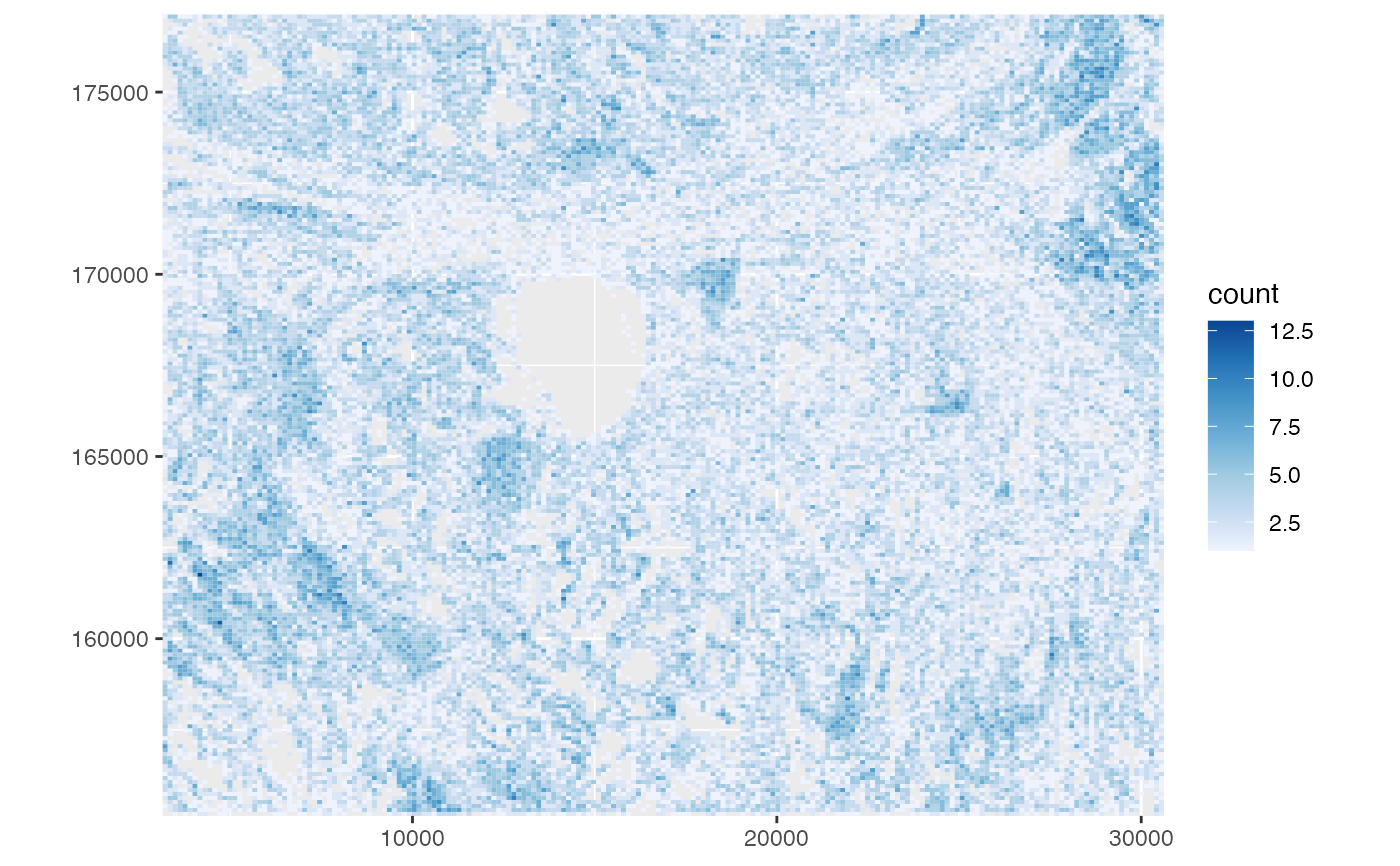
This function plots cell density in histological space as 2D histograms, especially helpful for larger smFISH-based datasets.
Usage
plotCellBin2D(
  sfe,
  sample_id = "all",
  bins = 200,
  binwidth = NULL,
  hex = FALSE,
  ncol = NULL,
  bbox = NULL
)
Arguments
- sfe
A
SpatialFeatureExperimentobject.- sample_id
Sample(s) in the SFE object whose cells/spots to use. Can be "all" to compute metric for all samples; the metric is computed separately for each sample.
- bins
Number of bins. Can be a vector of length 2 to specify for x and y axes separately.
- binwidth
Width of bins, passed to
geom_bin2dorgeom_hex.- hex
Logical, whether to use hexagonal bins.
- ncol
Number of columns if plotting multiple features. Defaults to
NULL, which means using the same logic asfacet_wrap, which is used bypatchwork'swrap_plotsby default.- bbox
A bounding box to specify a smaller region to plot, useful when the dataset is large. Can be a named numeric vector with names "xmin", "xmax", "ymin", and "ymax", in any order. If plotting multiple samples, it should be a matrix with sample IDs as column names and "xmin", "ymin", "xmax", and "ymax" as row names. If multiple samples are plotted but
bboxis a vector rather than a matrix, then the same bounding box will be used for all samples. You may see points at the edge of the geometries if the intersection between the bounding box and a geometry happens to be a point there. IfNULL, then the entire tissue is plotted.
Examples
library(SFEData)
sfe <- HeNSCLCData()
#> see ?SFEData and browseVignettes('SFEData') for documentation
#> downloading 1 resources
#> retrieving 1 resource
#> loading from cache
plotCellBin2D(sfe)