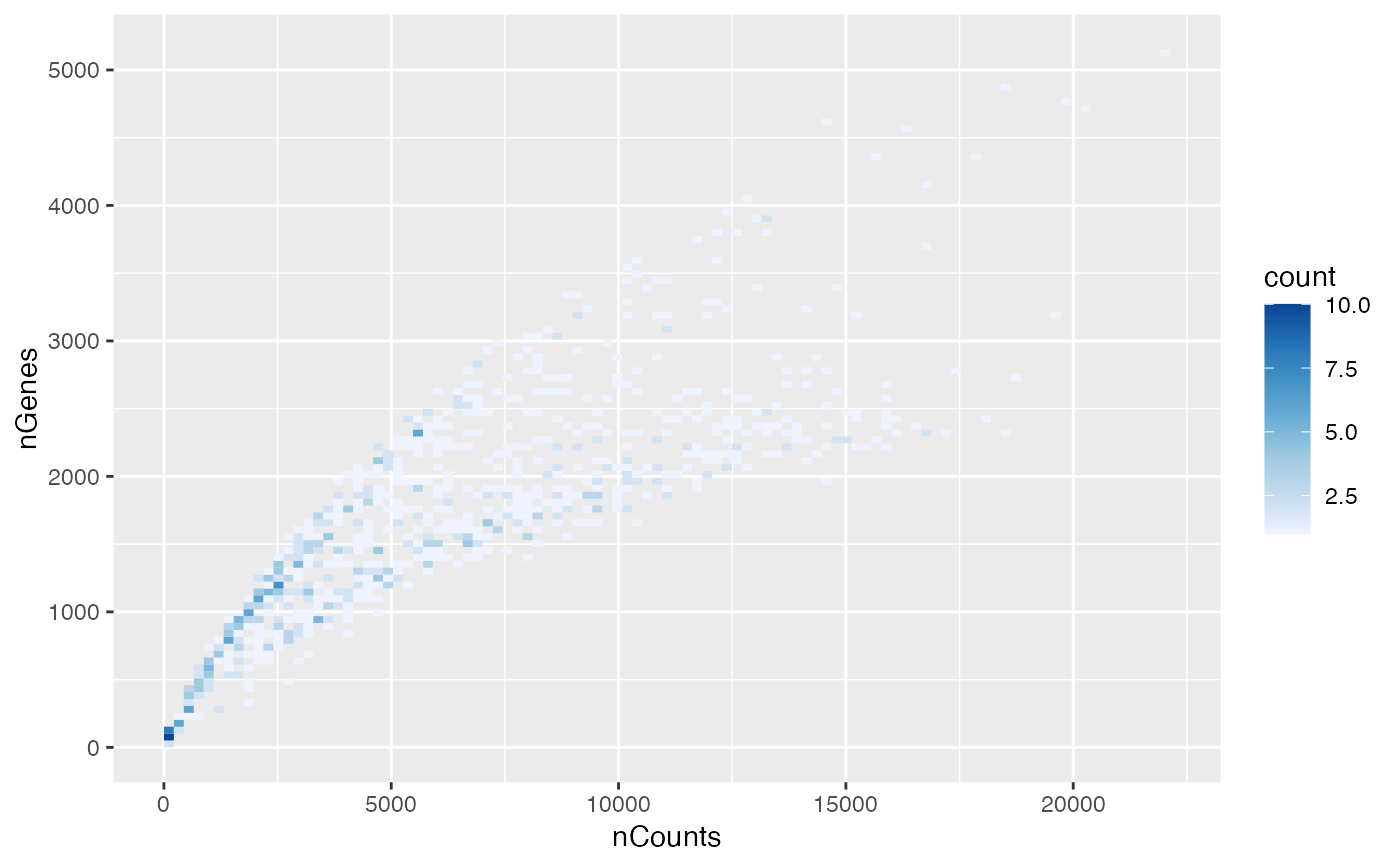
To avoid overplotting in large datasets. The 2D histogram is more informative of point density on the plot than the scatter plot where there are so many points plotted that they effectively form a solid block.
Usage
plotColDataBin2D(
  sce,
  x,
  y,
  facet_by = NULL,
  subset = NULL,
  bins = 100,
  binwidth = NULL,
  hex = FALSE,
  name_true = NULL,
  name_false = NULL,
  ncol = NULL,
  ...
)

plotRowDataBin2D(
  sce,
  x,
  y,
  facet_by = NULL,
  subset = NULL,
  bins = 100,
  binwidth = NULL,
  hex = FALSE,
  name_true = NULL,
  name_false = NULL,
  ncol = NULL,
  ...
)
Arguments
- sce
A
SingleCellExperimentobject.- x
Name of the column in
colDataorrowDatato plot on the x axis of the plot.- y
Name of the column in
colDataorrowDatato plot on the y axis of the plot.- facet_by
Column in
colDataorrowDatato facet with.- subset
Name of a logical column in
colDataorrowData, indicating cells or genes to plot with a different palette. Since the 2D histogram is effectively an opaque heatmap, don't use this argument unless the two groups are largely non-overlapping in the variables being plotted.- bins
Numeric vector giving number of bins in both vertical and horizontal directions. Set to 100 by default.
- binwidth
Numeric vector giving bin width in both vertical and horizontal directions. Overrides
binsif both set.- hex
Logical, whether to use hexagon rather than rectangular bins. Requires the
hexbinpackage.- name_true
Character, name to show on the legend for cells or genes indicated
TRUEin thesubsetargument.- name_false
Character, name to show on the legend for cells or genes indicated
FALSEin thesubsetargument.- ncol
If facetting, the number of columns of facets, passed to
facet_wrap.- ...
Other arguments passed on to
layer(). These are often aesthetics, used to set an aesthetic to a fixed value, likecolour = "red"orsize = 3. They may also be parameters to the paired geom/stat.
Examples
library(SFEData)
sfe <- McKellarMuscleData()
#> see ?SFEData and browseVignettes('SFEData') for documentation
#> loading from cache
sfe <- sfe[, sfe$in_tissue]
plotColDataBin2D(sfe, "nCounts", "nGenes")
#> Warning: plotCol/RowDataBin2D() was deprecated in Voyager 1.2.0.
#> ℹ Please use scater::plotCol/RowData() instead.
#> ℹ Set `bins` argument to enable binning.