Plot frequency polygons for colData and rowData columns
Source:R/plot-non-spatial.R
plotColDataFreqpoly.RdThis function is recommended instead of plotColDataHistogram
when coloring by multiple categories and log transforming the y axis, which
causes problems in stacked histograms.
Usage
plotColDataFreqpoly(
  sce,
  feature,
  color_by = NULL,
  subset = NULL,
  bins = 100,
  binwidth = NULL,
  linewidth = 1.2,
  scales = "free",
  ncol = 1,
  position = "identity"
)

plotRowDataFreqpoly(
  sce,
  feature,
  color_by = NULL,
  subset = NULL,
  bins = 100,
  binwidth = NULL,
  linewidth = 1.2,
  scales = "free",
  ncol = 1,
  position = "identity"
)
Arguments
- sce
A
SingleCellExperimentobject.- feature
Names of columns in
colDataorrowDatato plot. When multiple features are specified, they will be plotted in separate facets.- color_by
Name of a categorical column in
colDataorrowDatato color the polygons.- subset
Name of a logical column to only plot a subset of the data.
- bins
Number of bins. Overridden by
binwidth. Defaults to 30.- binwidth
The width of the bins. Can be specified as a numeric value or as a function that calculates width from unscaled x. Here, "unscaled x" refers to the original x values in the data, before application of any scale transformation. When specifying a function along with a grouping structure, the function will be called once per group. The default is to use the number of bins in
bins, covering the range of the data. You should always override this value, exploring multiple widths to find the best to illustrate the stories in your data.The bin width of a date variable is the number of days in each time; the bin width of a time variable is the number of seconds.
- linewidth
Line width of the polygons, defaults to a thicker 1.2.
- scales
Should scales be fixed (
"fixed", the default), free ("free"), or free in one dimension ("free_x","free_y")?- ncol
Number of columns in the facetting.
- position
A position adjustment to use on the data for this layer. This can be used in various ways, including to prevent overplotting and improving the display. The
positionargument accepts the following:The result of calling a position function, such as
position_jitter(). This method allows for passing extra arguments to the position.A string naming the position adjustment. To give the position as a string, strip the function name of the
position_prefix. For example, to useposition_jitter(), give the position as"jitter".For more information and other ways to specify the position, see the layer position documentation.
Examples
library(SFEData)
sfe <- McKellarMuscleData()
#> see ?SFEData and browseVignettes('SFEData') for documentation
#> loading from cache
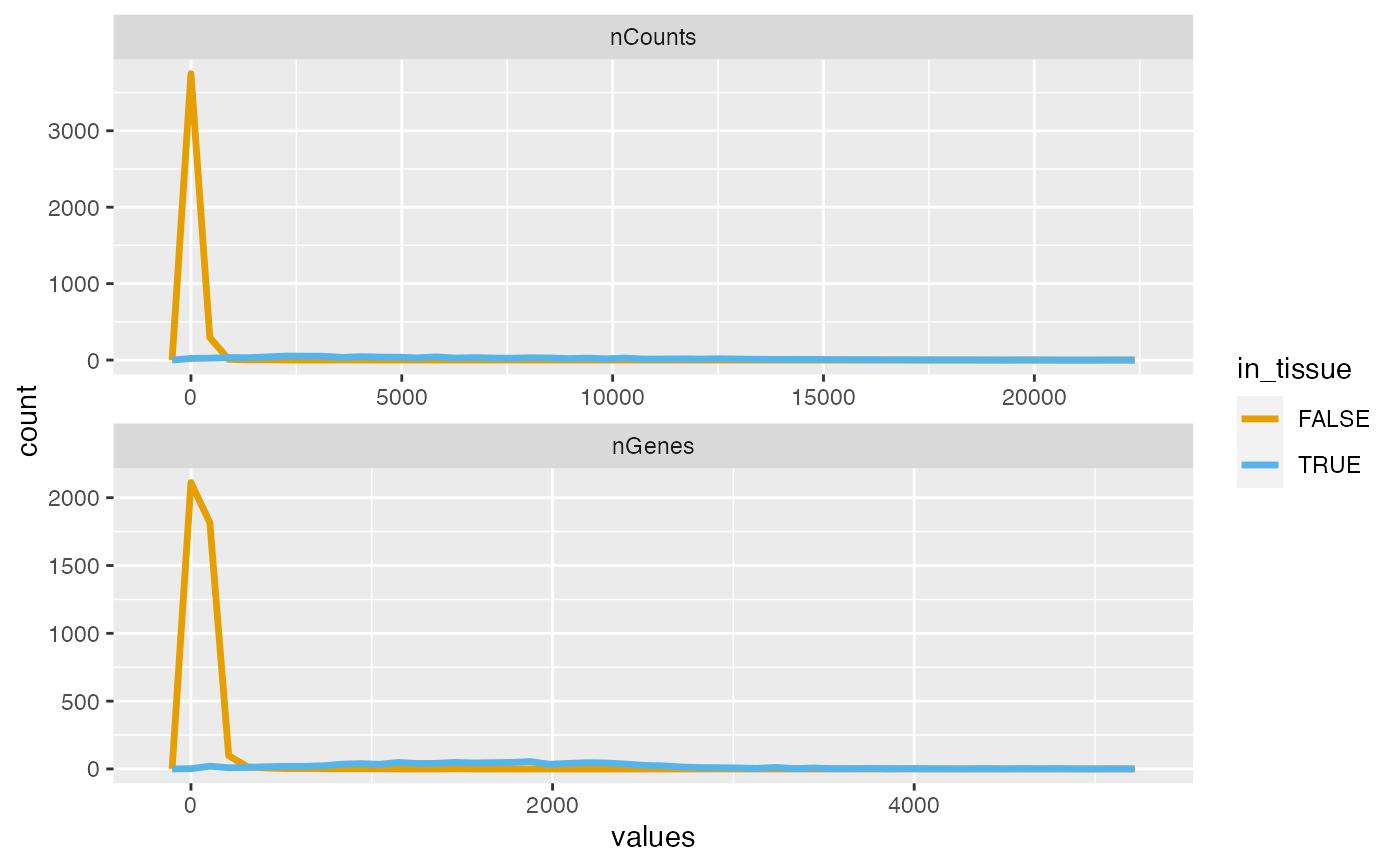
plotColDataFreqpoly(sfe, c("nCounts", "nGenes"), color_by = "in_tissue",
bins = 50)
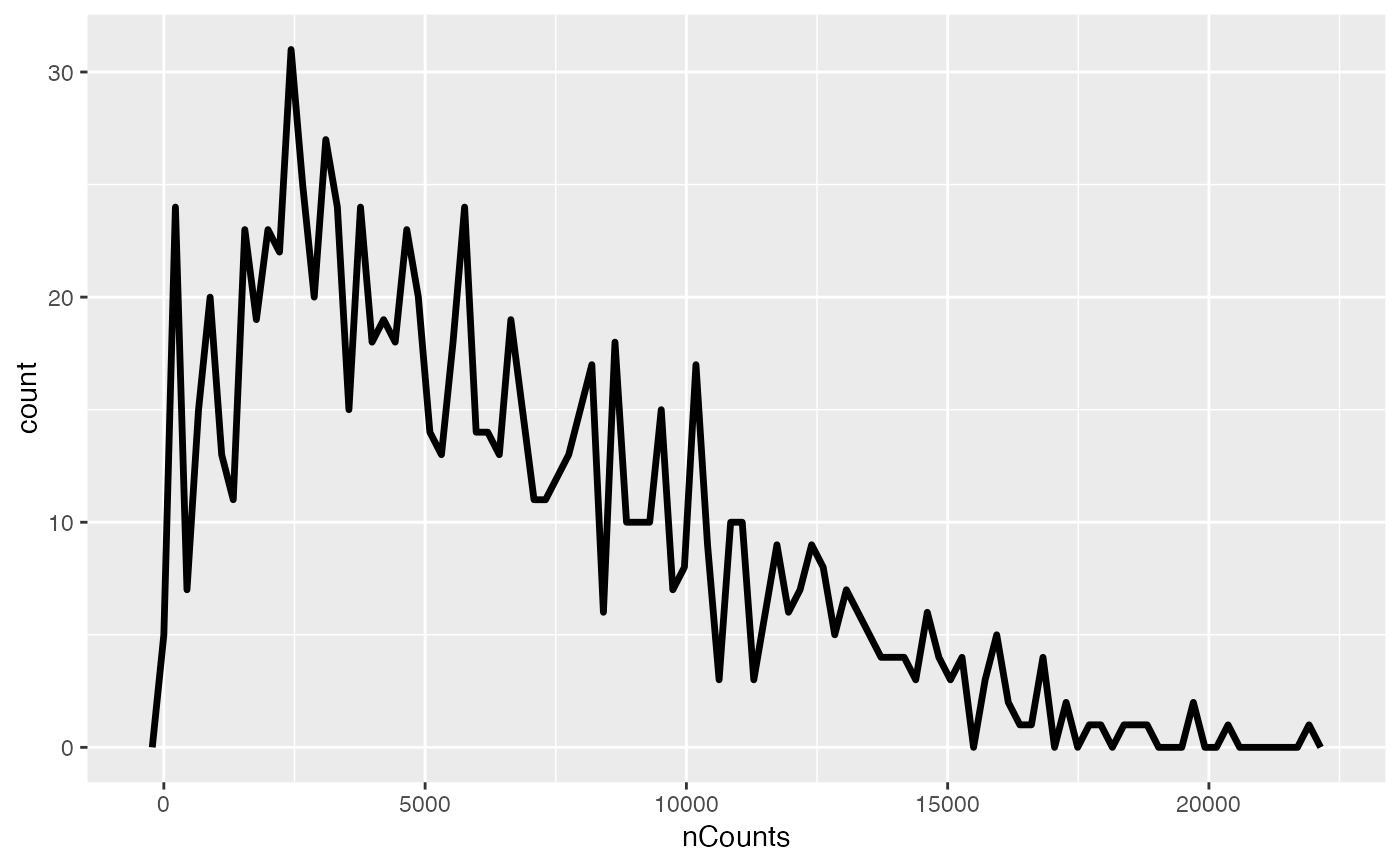
 plotColDataFreqpoly(sfe, "nCounts", subset = "in_tissue")
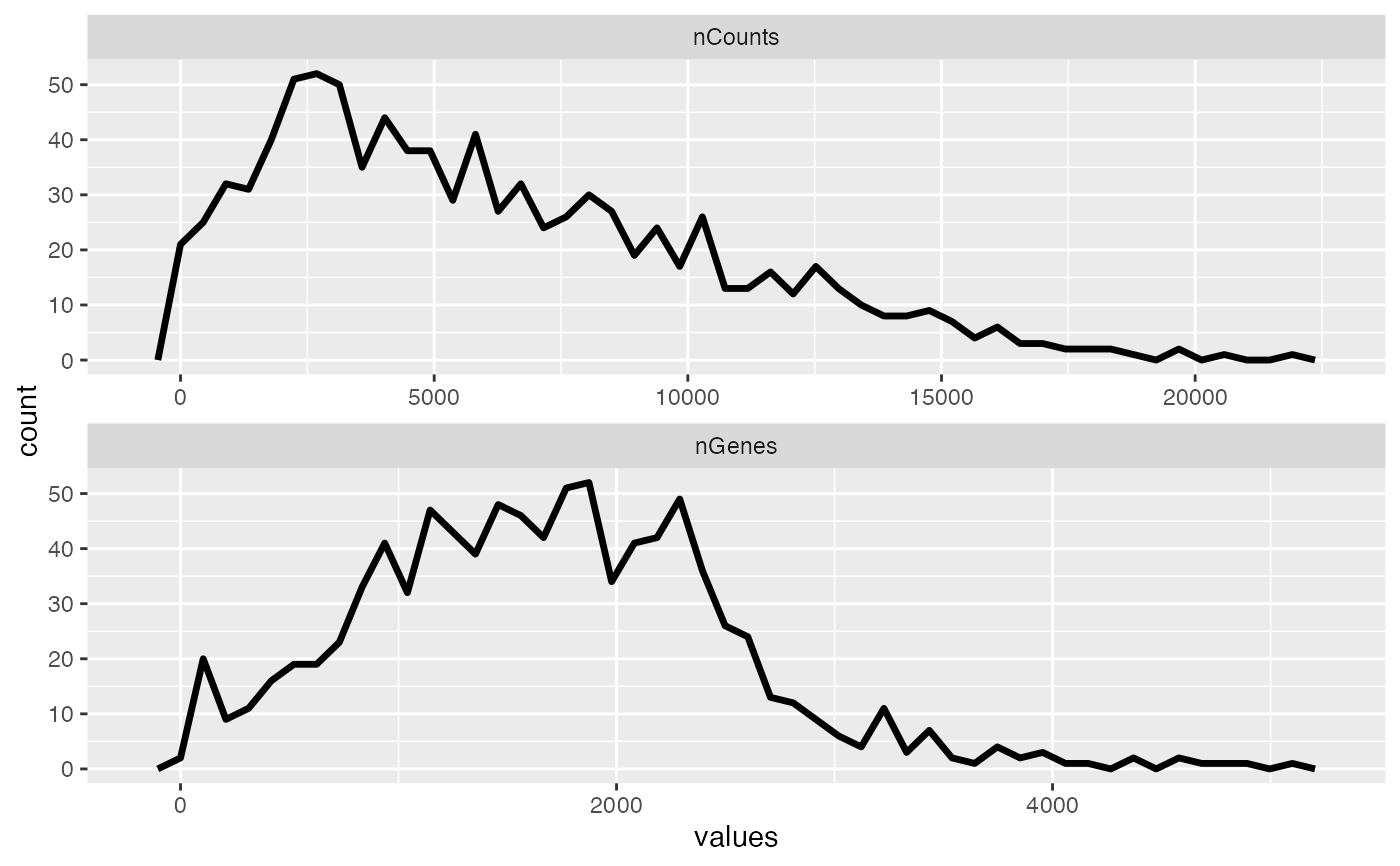
 sfe2 <- sfe[, sfe$in_tissue]
plotColDataFreqpoly(sfe2, c("nCounts", "nGenes"), bins = 50)
sfe2 <- sfe[, sfe$in_tissue]
plotColDataFreqpoly(sfe2, c("nCounts", "nGenes"), bins = 50)