Equivalent to gstat::plot.gstatVariogram, but using ggplot2 to be more
customizable.
Arguments
- res
Cross variogram results for one sample, from
calculateBivariate. Global bivariate results are not stored in the SFE object.- show_np
Logical, whether to show number of pairs of cells at each distance bin.
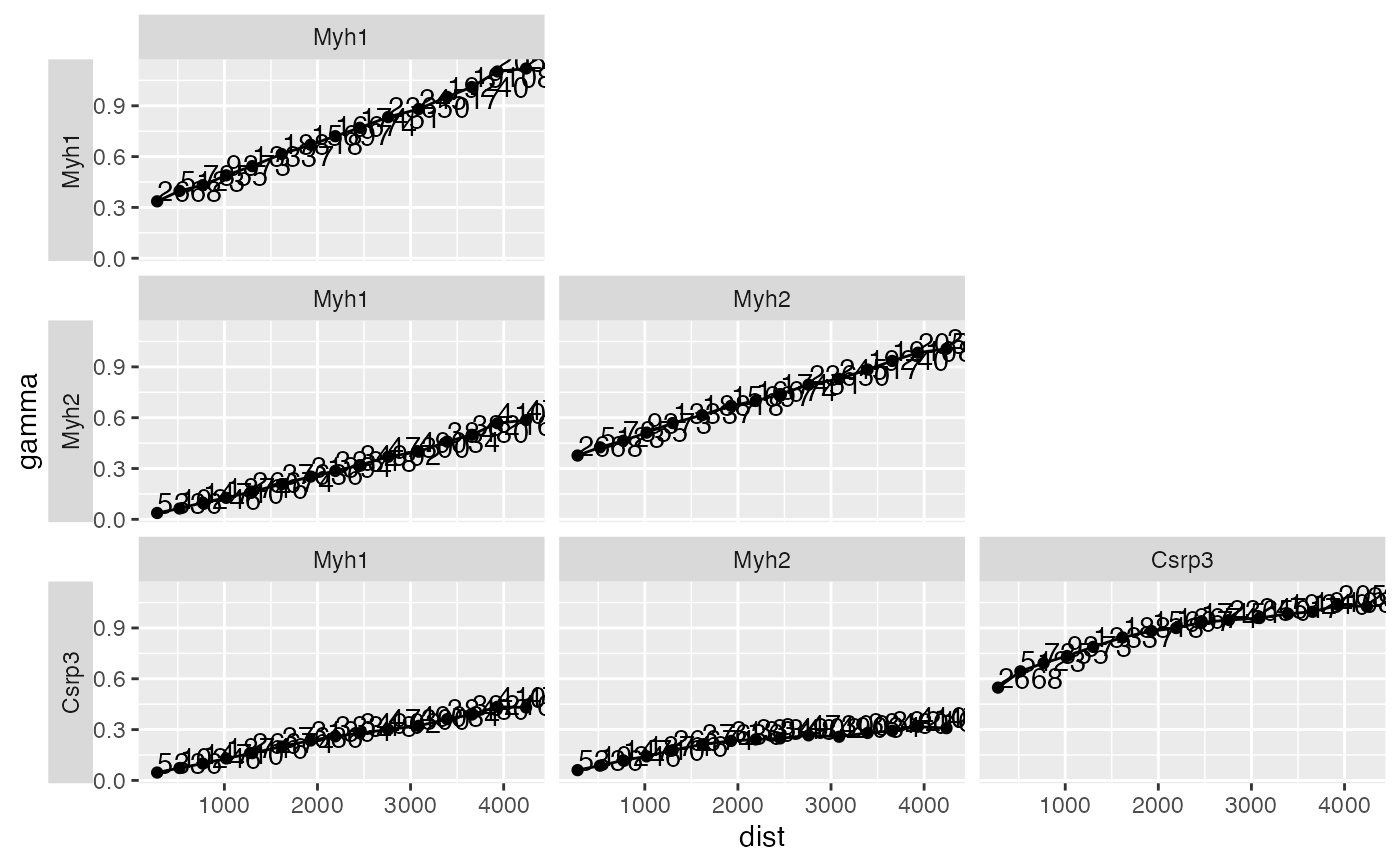
Value
A ggplot object. Unfortunately I haven't figured out a way to collect all the facet labels to the top of the entire plot.
Examples
library(SFEData)
library(scater)
sfe <- McKellarMuscleData()
#> see ?SFEData and browseVignettes('SFEData') for documentation
#> loading from cache
sfe <- sfe[,sfe$in_tissue]
sfe <- logNormCounts(sfe)

res <- calculateBivariate(sfe, type = "cross_variogram",
feature1 = c("Myh1", "Myh2", "Csrp3"), swap_rownames = "symbol")
plotCrossVariogram(res)