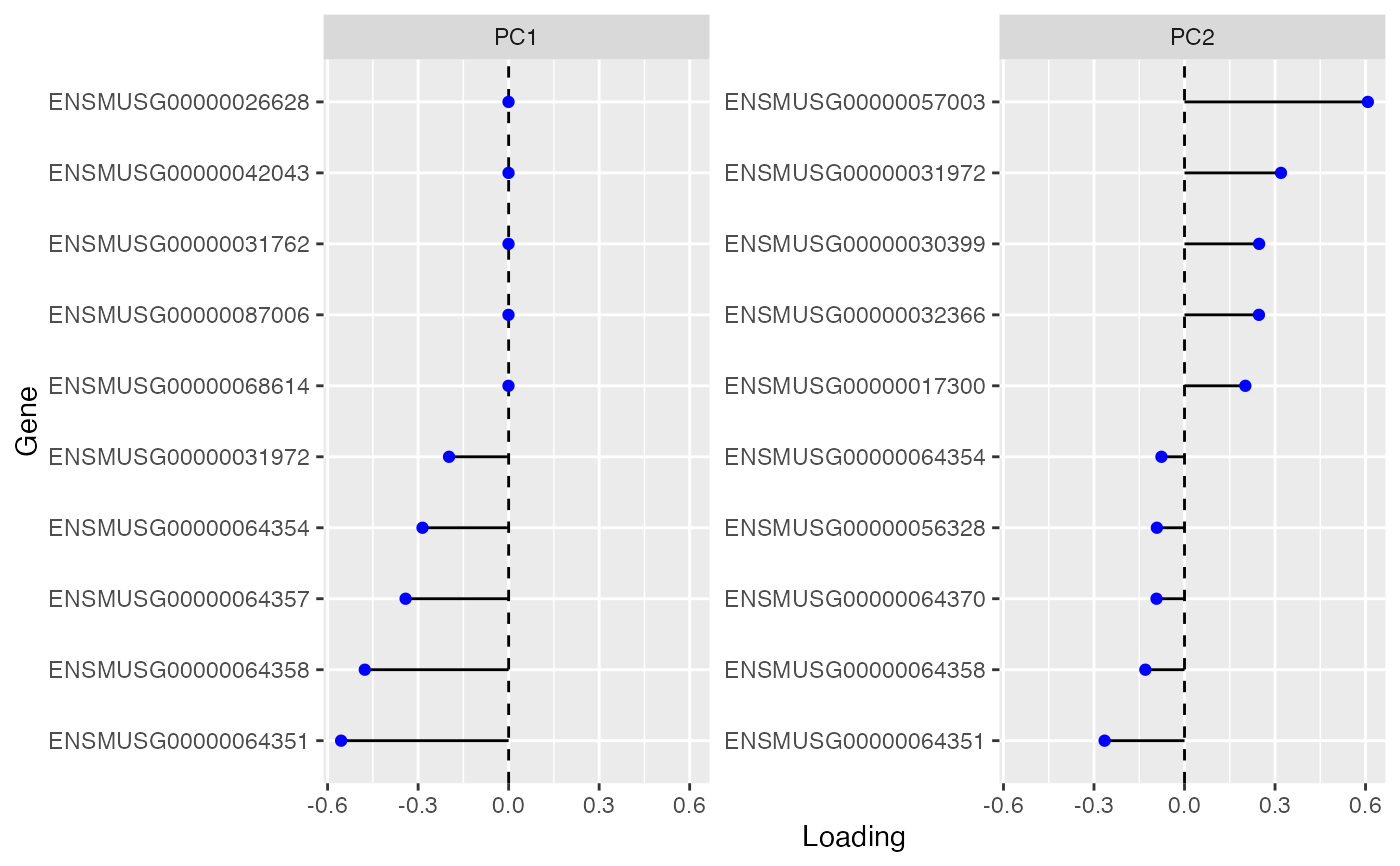
Just like Seurat's VizDimLoadings function. I haven't found an equivalent for SCE but find it useful. But I'm not trying to reproduce that Seurat function exactly. For instance, I don't like it when Seurat imposes a ggplot theme, and I don't like the cowplot theme. Maybe I should rewrite it in base R but for now I'm using Tidyverse.
Usage
plotDimLoadings(
  sce,
  dims = 1:4,
  nfeatures = 10,
  swap_rownames = NULL,
  reduction = "PCA",
  balanced = TRUE,
  ncol = 2,
  sample_id = "all"
)
Arguments
- sce
A
SingleCellExperimentobject, or anything that inherits fromSingleCellExperiment.- dims
Numeric vector specifying which PCs to plot. For MULTISPATI, PCs with negative eigenvalues are in the right most columns of the embedding and loading matrices. See the
ElbowPlot.- nfeatures
Number of genes to plot.
- swap_rownames
Column name of
rowData(object)to be used to identify features instead ofrownames(object)when labeling plot elements. If not found inrowData, then rownames of the gene count matrix will be used.- reduction
Name of the dimension reduction to use. It must have an attribute called either "percentVar" or "eig" for eigenvalues. Defaults to "PCA".
- balanced
Return an equal number of genes with + and - scores. If FALSE, returns the top genes ranked by the scores absolute values.
- ncol
Number of columns in the facetted plot.
- sample_id
Sample(s) in the SFE object whose cells/spots to use. Can be "all" to compute metric for all samples; the metric is computed separately for each sample.
