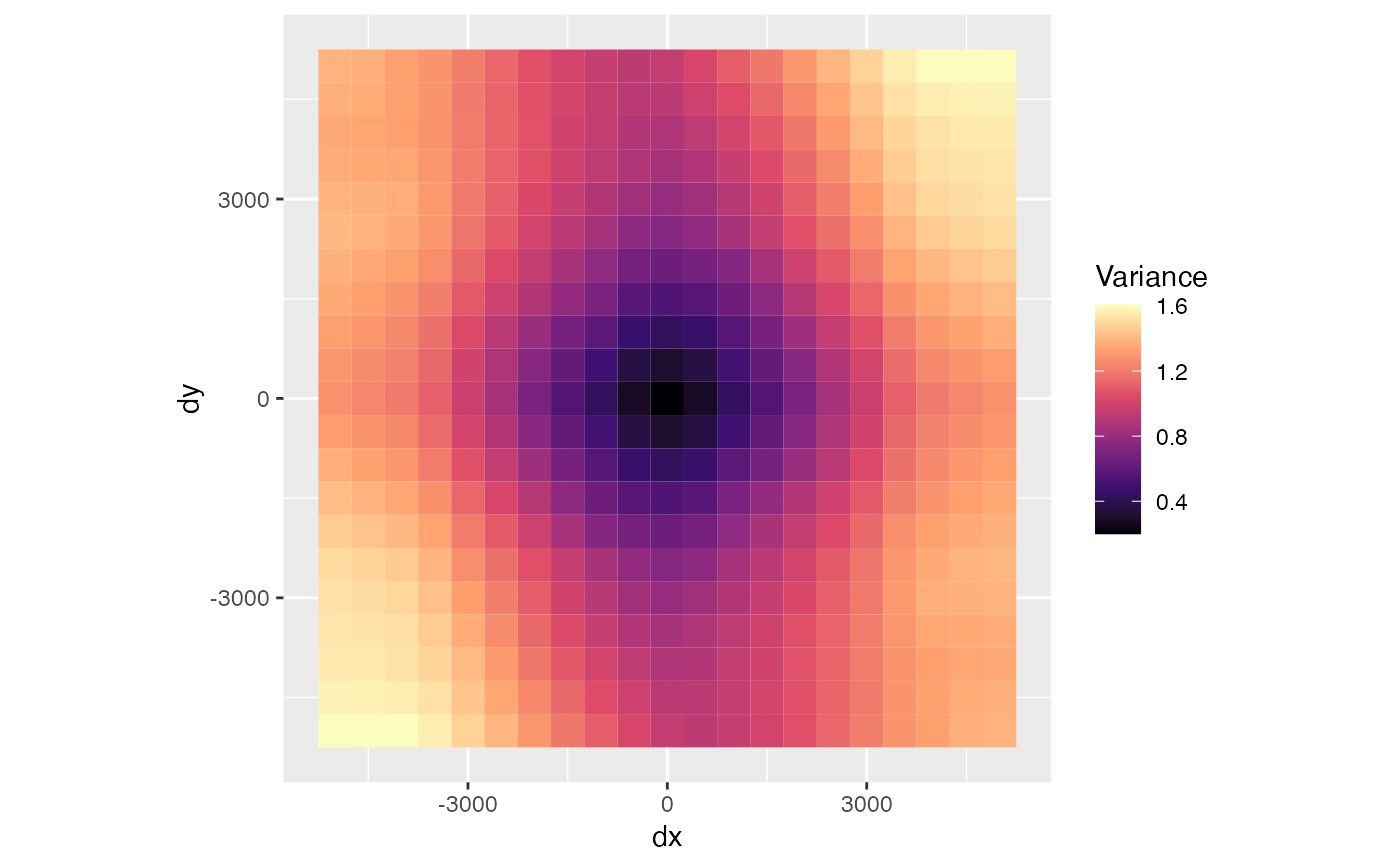
Plot variogram maps that show the variogram in all directions in a grid of distances in x and y coordinates.
Usage
plotVariogramMap(
  sfe,
  features,
  sample_id = "all",
  plot_np = FALSE,
  ncol = NULL,
  colGeometryName = NULL,
  annotGeometryName = NULL,
  reducedDimName = NULL,
  swap_rownames = NULL,
  name = "variogram_map"
)
Arguments
- sfe
A
SpatialFeatureExperimentobject.- features
Features to plot, must be in rownames of the gene count matrix, colnames of colData or a colGeometry, colnames of cell embeddings in
reducedDim, or numeric indices of dimension reduction components.- sample_id
Sample(s) in the SFE object whose cells/spots to use. Can be "all" to compute metric for all samples; the metric is computed separately for each sample.
- plot_np
Logical, whether to plot the number of pairs in each distance bin instead of the variance.
- ncol
Number of columns if facetting.
- colGeometryName
Name of a
colGeometrysfdata frame whose numeric columns of interest are to be used to compute the metric. UsecolGeometryNamesto look up names of thesfdata frames associated with cells/spots.- annotGeometryName
Name of a
annotGeometryof the SFE object, to annotate the gene expression plot.- reducedDimName
Name of a dimension reduction, can be seen in
reducedDimNames.colGeometryNameandannotGeometryNamehave precedence overreducedDimName.- swap_rownames
Column name of
rowData(object)to be used to identify features instead ofrownames(object)when labeling plot elements. If not found inrowData, then rownames of the gene count matrix will be used.- name
Name under which the correlogram results are stored, which is by default "sp.correlogram".
Examples
library(SFEData)
sfe <- McKellarMuscleData()
#> see ?SFEData and browseVignettes('SFEData') for documentation
#> loading from cache
sfe <- colDataUnivariate(sfe, "variogram_map", features = "nCounts",
width = 500, cutoff = 5000)
plotVariogramMap(sfe, "nCounts")