Python arguments are equivalent to long-option arguments (
--arg), unless otherwise specified. Flags are True/False arguments in Python. The manual for any gget tool can be called from the command-line using the-h--helpflag.
gget cbio 📖
Plot cancer genomics heatmaps using data from cBioPortal using Ensembl IDs or gene names.
This module was written by Sam Wagenaar.
Positional argument
subcommand
Either search or plot
search subcommand (Python: gget.cbio_search)
Find cBioPortal study IDs by keyword.
Return format: JSON (command-line) or string list (Python).
Note: This does not return studies with mixed cancer types.
Positional argument
keywords
Space-separated list of keywords to search for, e.g. breast lung.
Python: Pass keywords as a list of strings.
plot subcommand (Python: gget.cbio_plot)
Plot cancer genomics heatmaps using data from cBioPortal. Return format: PNG (command-line and Python)
Required arguments
-s --study_ids
Space-separated list of cBioPortal study IDs, e.g. msk_impact_2017 egc_msk_2023.
-g --genes
Space-separated list of gene names or Ensembl IDs, e.g. NOTCH3 ENSG00000108375.
Optional arguments
-st --stratification
Column to stratify the data by. Default: tissue.
Options:
- tissue
- cancer_type
- cancer_type_detailed
- study_id
- sample
-vt --variation_type
Type of variation to plot. Default: mutation_occurrences.
Options:
- mutation_occurrences
- cna_nonbinary (Note:
stratificationmust be 'sample' for this option) - sv_occurrences
- cna_occurrences
- Consequence (Note:
stratificationmust be 'sample' for this option)
-f --filter
Filter the data by a specific value in a specific column, e.g. study_id:msk_impact_2017
Python: filter=(column, value)
-dd --data_dir
Directory to store data files. Default: ./gget_cbio_cache.
-fd --figure_dir
Directory to output figures. Default: ./gget_cbio_figures.
-fn --filename
Filename for the output figure, relative to figure_dir. Default: auto-generated
Python: figure_filename
-t --title
Title for the output figure. Default: auto-generated
Python: figure_title
-dpi --dpi
DPI of the output figure. Default: 100.
Flags
-q --quiet
Command-line only. Prevents progress information from being displayed.
Python: Use verbose=False to prevent progress information from being displayed.
-nc --no_confirm
Command-line only. Skip download confirmation prompts.
Python: Use confirm_download=True to enable download confirmation prompts.
-sh --show
Show the plot in a window (automatic in Jupyter notebooks).
Examples
Find all cBioPortal studies with cancer types matching specific keywords:
gget cbio search esophag ovary ovarian
# Python
import gget
gget.cbio_search(['esophag', 'ovary', 'ovarian'])
→ Returns a list of studies with cancer types matching the keywords esophag, ovary, or ovarian.
['egc_tmucih_2015', 'egc_msk_2017', ..., 'msk_spectrum_tme_2022']
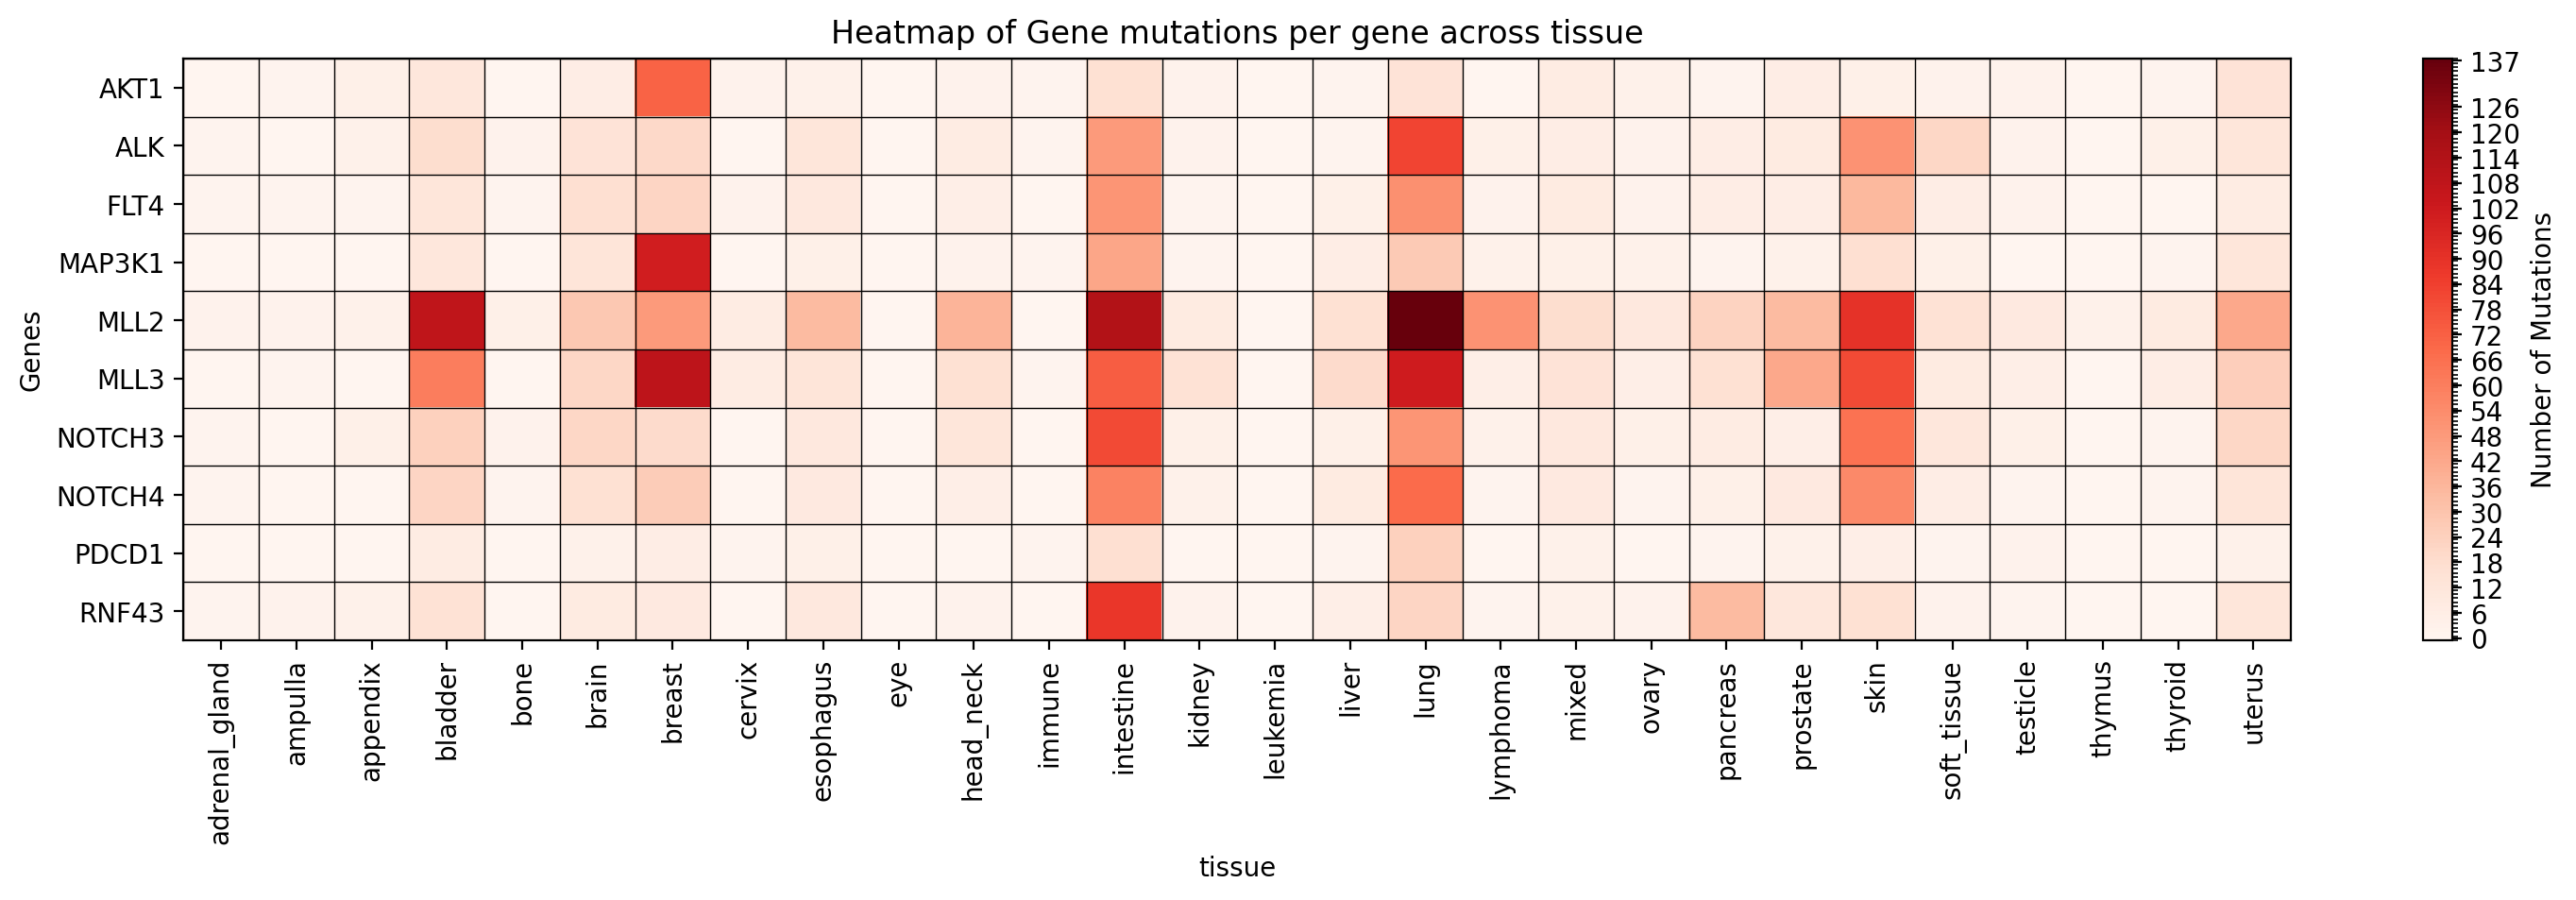
Plot a heatmap of mutation occurrences for specific genes in a specific study:
gget cbio plot \
    -s msk_impact_2017 \
    -g AKT1 ALK FLT4 MAP3K1 MLL2 MLL3 NOTCH3 NOTCH4 PDCD1 RNF43 \
    -st tissue \
    -vt mutation_occurrences \
    -dpi 200
# Python
import gget
gget.cbio_plot(
    ['msk_impact_2017'],
    ['AKT1', 'ALK', 'FLT4', 'MAP3K1', 'MLL2', 'MLL3', 'NOTCH3', 'NOTCH4', 'PDCD1', 'RNF43'],
    stratification='tissue',
    variation_type='mutation_occurrences',
    dpi=200
)
→ Saves a heatmap of mutation occurrences for the specified genes in the specified study to ./gget_cbio_figures/Heatmap_tissue.png.
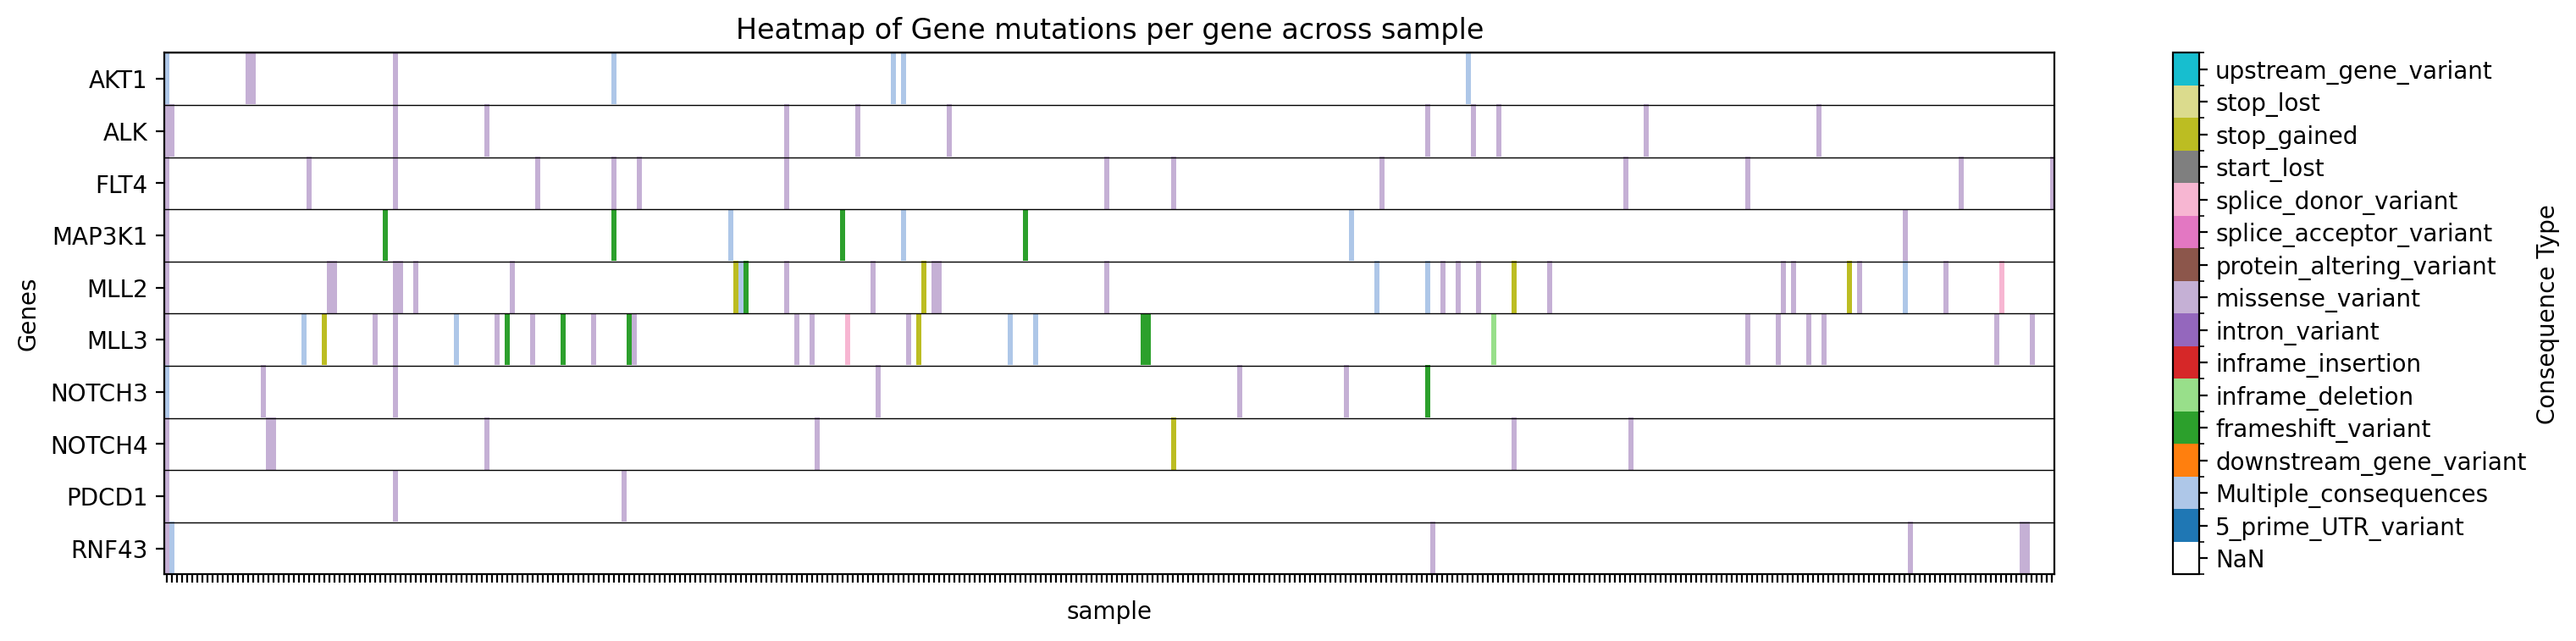
Plot a heatmap of mutation types for specific genes in a specific study:
gget cbio plot \
    -s msk_impact_2017 \
    -g AKT1 ALK FLT4 MAP3K1 MLL2 MLL3 NOTCH3 NOTCH4 PDCD1 RNF43 \
    -st sample \
    -vt Consequence \
    -dpi 200
# Python
import gget
gget.cbio_plot(
    ['msk_impact_2017'],
    ['AKT1', 'ALK', 'FLT4', 'MAP3K1', 'MLL2', 'MLL3', 'NOTCH3', 'NOTCH4', 'PDCD1', 'RNF43'],
    stratification='sample',
    variation_type='Consequence',
    dpi=200,
)
→ Saves a heatmap of mutation types for the specified genes in the specified study to ./gget_cbio_figures/Heatmap_sample.png.
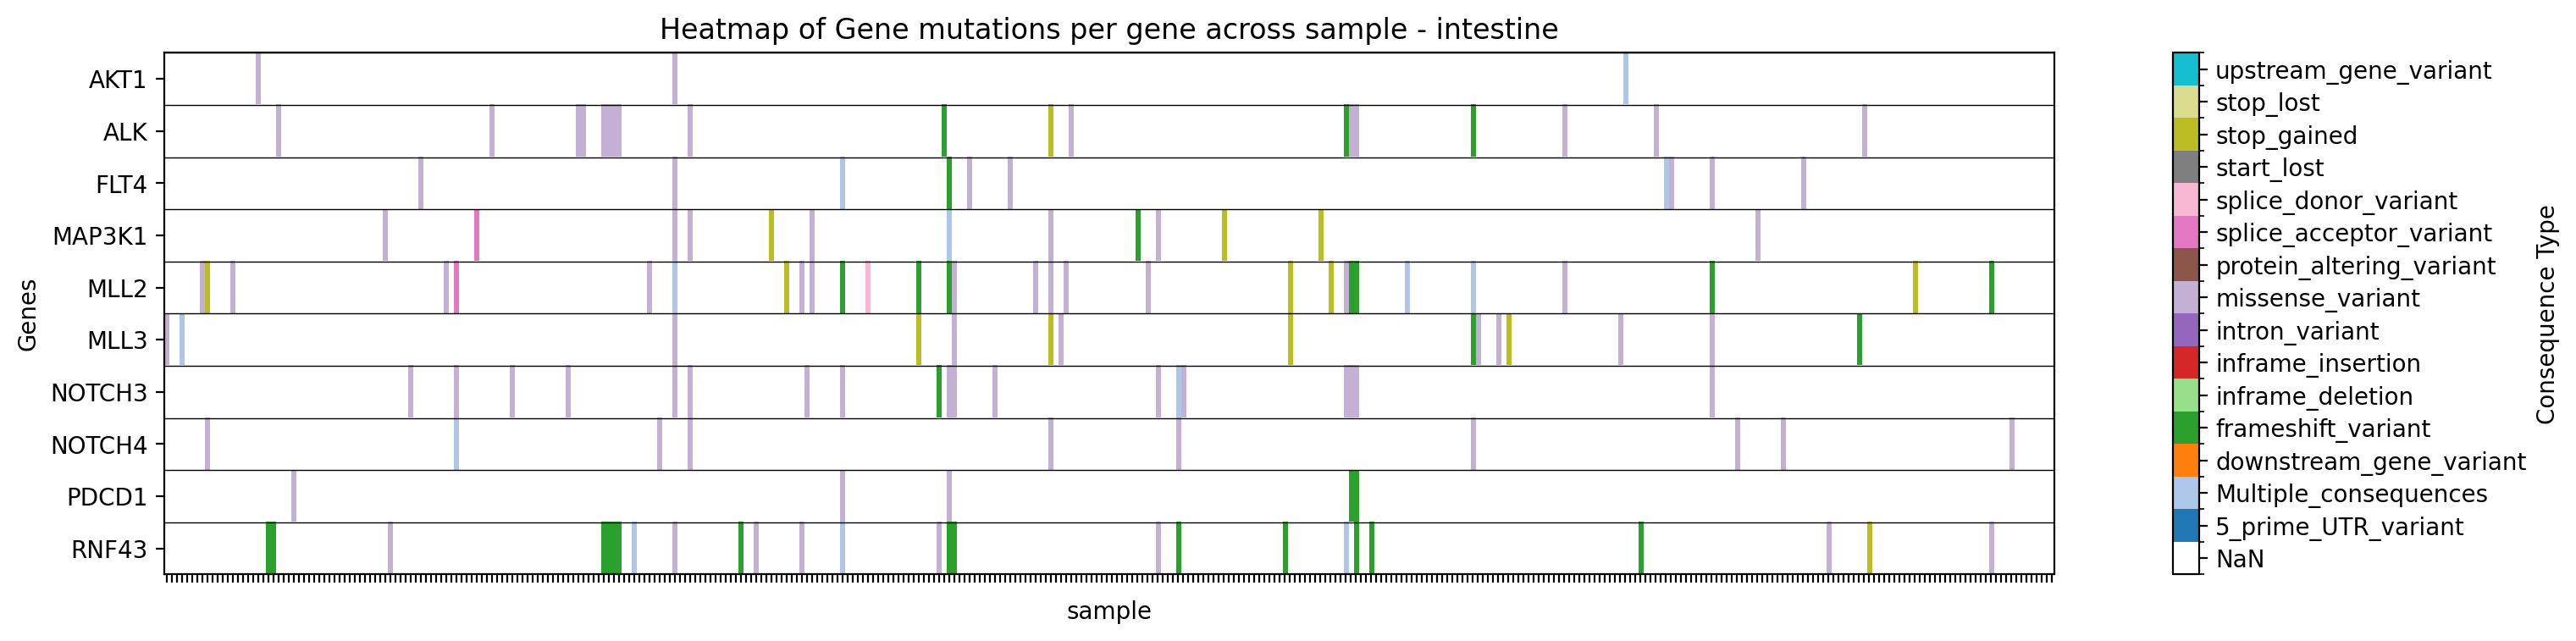
Plot a heatmap of mutation types for specific genes in a specific study, filtering by tissue:
gget cbio plot \
    -s msk_impact_2017 \
    -g AKT1 ALK FLT4 MAP3K1 MLL2 MLL3 NOTCH3 NOTCH4 PDCD1 RNF43 \
    -st sample \
    -vt Consequence \
    -f tissue:intestine \
    -dpi 200
# Python
import gget
gget.cbio_plot(
    ['msk_impact_2017'],
    ['AKT1', 'ALK', 'FLT4', 'MAP3K1', 'MLL2', 'MLL3', 'NOTCH3', 'NOTCH4', 'PDCD1', 'RNF43'],
    stratification='sample',
    variation_type='Consequence',
    filter=('tissue', 'intestine'),
    dpi=200,
)
→ Saves a heatmap of mutation types for the specified genes in the specified study, filtered by tissue, to ./gget_cbio_figures/Heatmap_sample_intestine.png.
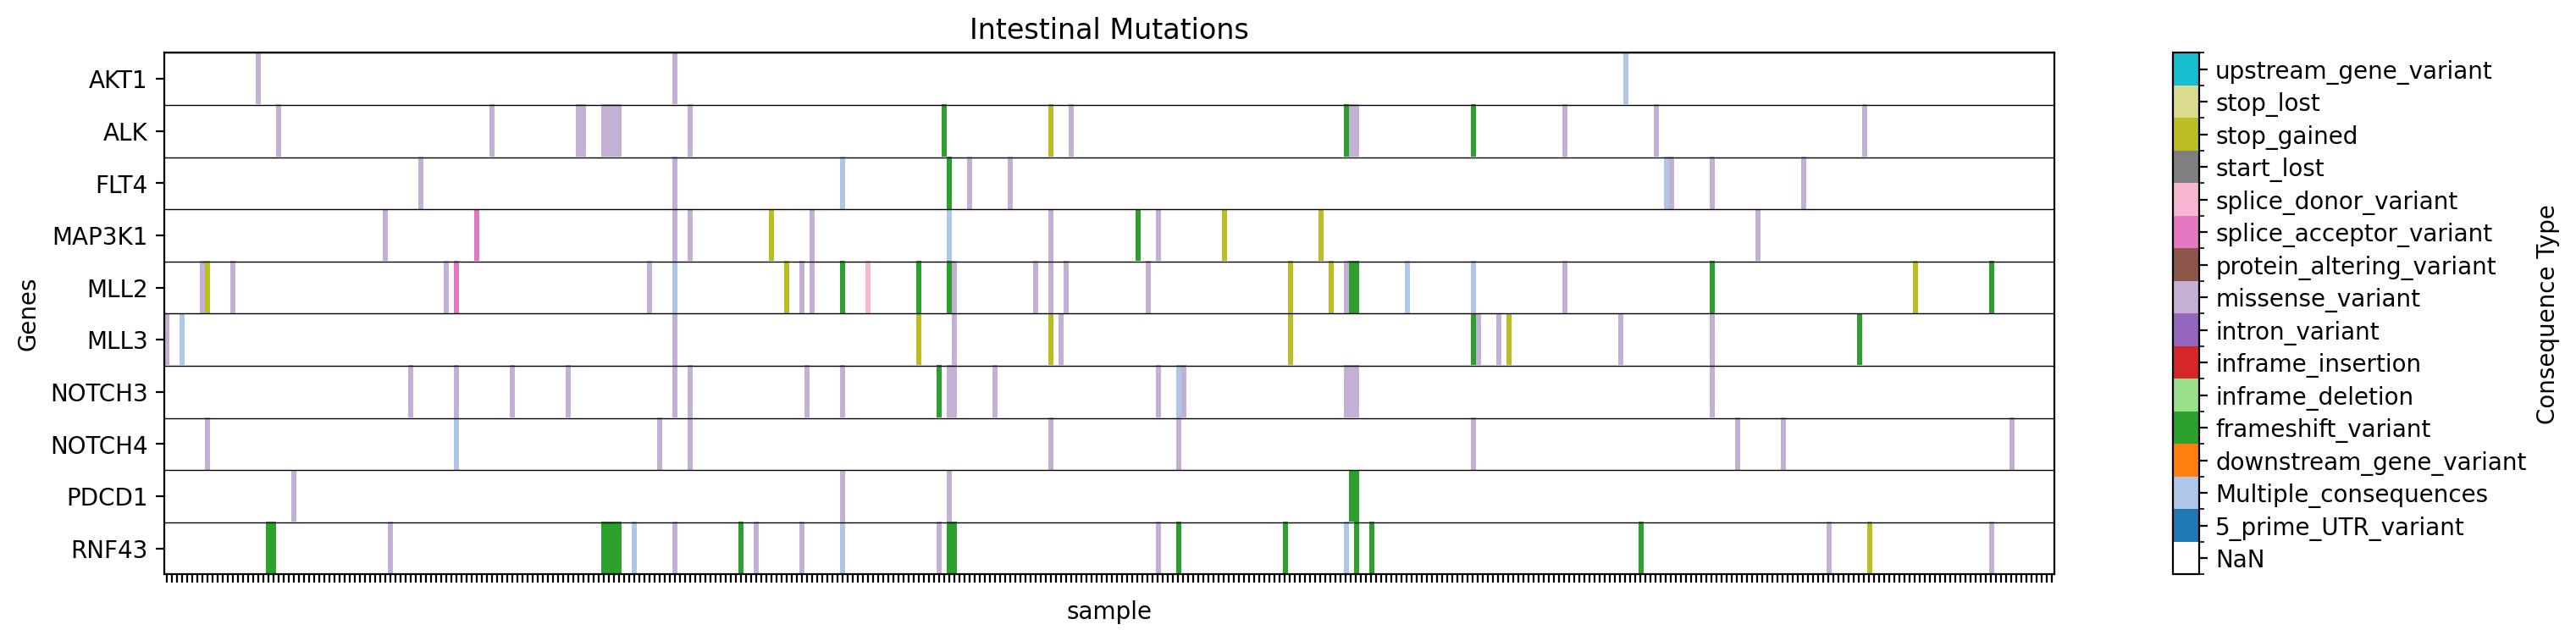
Plot a heatmap with a custom title and filename:
gget cbio plot \
    -s msk_impact_2017 \
    -g AKT1 ALK FLT4 MAP3K1 MLL2 MLL3 NOTCH3 NOTCH4 PDCD1 RNF43 \
    -st sample \
    -vt Consequence \
    -f tissue:intestine \
    -dpi 200 \
    -t "Intestinal Mutations" \
    -fn intestinal_mutations.png
# Python
import gget
gget.cbio_plot(
    ['msk_impact_2017'],
    ['AKT1', 'ALK', 'FLT4', 'MAP3K1', 'MLL2', 'MLL3', 'NOTCH3', 'NOTCH4', 'PDCD1', 'RNF43'],
    stratification='sample',
    variation_type='Consequence',
    filter=('tissue', 'intestine'),
    dpi=200,
    figure_title='Intestinal Mutations',
    figure_filename='intestinal_mutations.png'
)
→ Saves a heatmap of mutation types for the specified genes in the specified study, filtered by tissue, with the title "Intestinal Mutations" to ./gget_cbio_figures/intestinal_mutations.png.
More examples
References
If you use gget cbio in a publication, please cite the following articles:
-
Luebbert, L., & Pachter, L. (2023). Efficient querying of genomic reference databases with gget. Bioinformatics. https://doi.org/10.1093/bioinformatics/btac836
-
Cerami E, Gao J, Dogrusoz U, Gross BE, Sumer SO, Aksoy BA, Jacobsen A, Byrne CJ, Heuer ML, Larsson E, Antipin Y, Reva B, Goldberg AP, Sander C, Schultz N. The cBio cancer genomics portal: an open platform for exploring multidimensional cancer genomics data. Cancer Discov. 2012 May;2(5):401-4. doi: 10.1158/2159-8290.CD-12-0095. Erratum in: Cancer Discov. 2012 Oct;2(10):960. PMID: 22588877; PMCID: PMC3956037.
-
Gao J, Aksoy BA, Dogrusoz U, Dresdner G, Gross B, Sumer SO, Sun Y, Jacobsen A, Sinha R, Larsson E, Cerami E, Sander C, Schultz N. Integrative analysis of complex cancer genomics and clinical profiles using the cBioPortal. Sci Signal. 2013 Apr 2;6(269):pl1. doi: 10.1126/scisignal.2004088. PMID: 23550210; PMCID: PMC4160307.
-
de Bruijn I, Kundra R, Mastrogiacomo B, Tran TN, Sikina L, Mazor T, Li X, Ochoa A, Zhao G, Lai B, Abeshouse A, Baiceanu D, Ciftci E, Dogrusoz U, Dufilie A, Erkoc Z, Garcia Lara E, Fu Z, Gross B, Haynes C, Heath A, Higgins D, Jagannathan P, Kalletla K, Kumari P, Lindsay J, Lisman A, Leenknegt B, Lukasse P, Madela D, Madupuri R, van Nierop P, Plantalech O, Quach J, Resnick AC, Rodenburg SYA, Satravada BA, Schaeffer F, Sheridan R, Singh J, Sirohi R, Sumer SO, van Hagen S, Wang A, Wilson M, Zhang H, Zhu K, Rusk N, Brown S, Lavery JA, Panageas KS, Rudolph JE, LeNoue-Newton ML, Warner JL, Guo X, Hunter-Zinck H, Yu TV, Pilai S, Nichols C, Gardos SM, Philip J; AACR Project GENIE BPC Core Team, AACR Project GENIE Consortium; Kehl KL, Riely GJ, Schrag D, Lee J, Fiandalo MV, Sweeney SM, Pugh TJ, Sander C, Cerami E, Gao J, Schultz N. Analysis and Visualization of Longitudinal Genomic and Clinical Data from the AACR Project GENIE Biopharma Collaborative in cBioPortal. Cancer Res. 2023 Dec 1;83(23):3861-3867. doi: 10.1158/0008-5472.CAN-23-0816. PMID: 37668528; PMCID: PMC10690089.
-
Please also cite the source of the data if you are using a publicly available dataset.